FR
FR JA
JA

In order to complete Step 2- Prepare the data, you will need to do the following
Step1- Open the file in excel
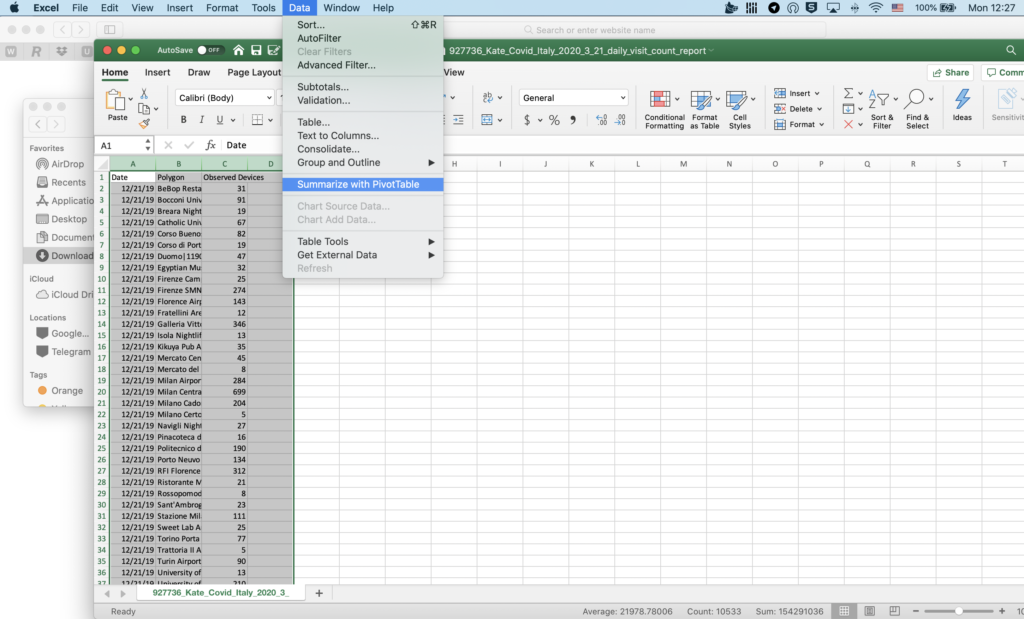
1. Reports downloaded from Vista are in .tsv format
Step 2- Aggregate the file using pivot tables
2. Select all three columns from the top and go to Data/ Summarize with PivotTable
5. Since you have already selected the range, it will appear on the top in “Select a table or range” field
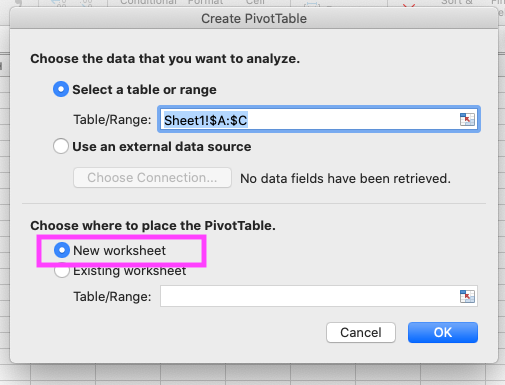
6. The recommendation is selecting “New Worksheet” when deciding where to place the PivotTable
7. Drag Date into the Rows box and Drag Observed Devices into the Values box.
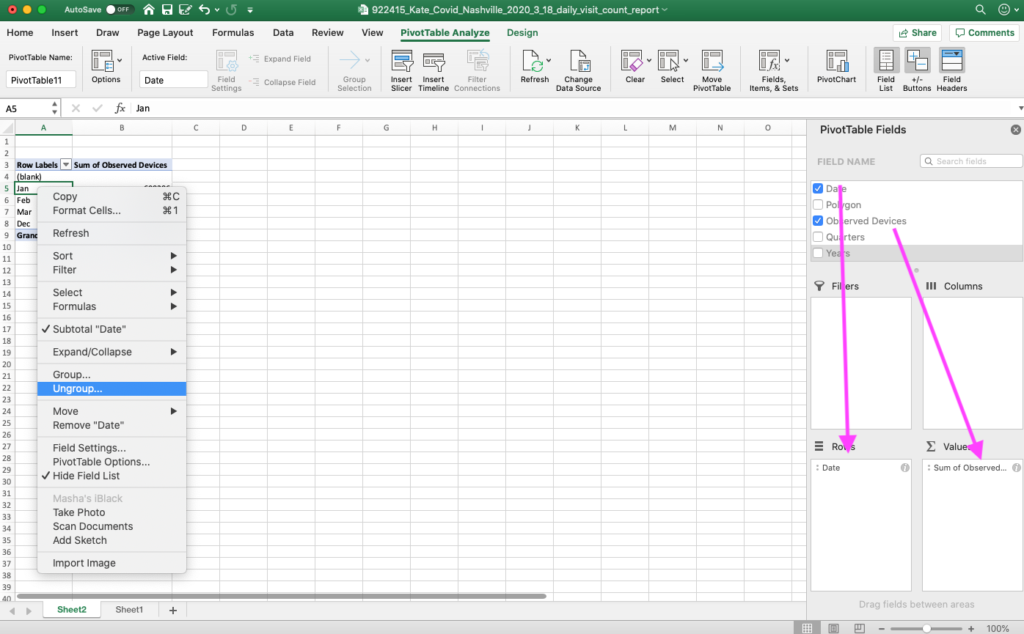
8. This will create your table with the two columns you want (date, observed devices).
9. Data for all locations will now be aggregated for every date.
10. Next, you want to select a month in the generated column, right-click on it and select Ungroup from the context menu
11. In some cases, the dates will already be displayed by days so you don’t have to ungroup anything.
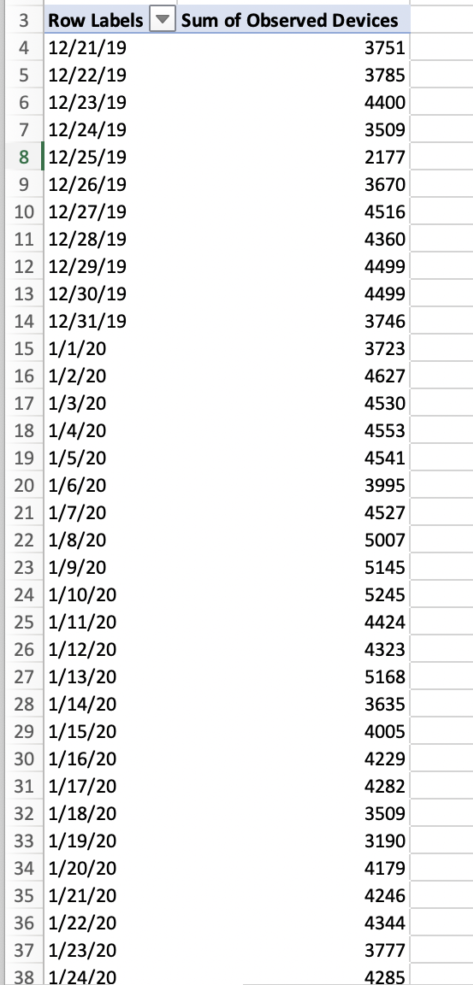
Step 3- Finalize the file
Example of data you are looking to get:
Azira copyright notice and disclaimer: No reproduction or use is permitted without Azira’s express written consent.