FR
FR JA
JA

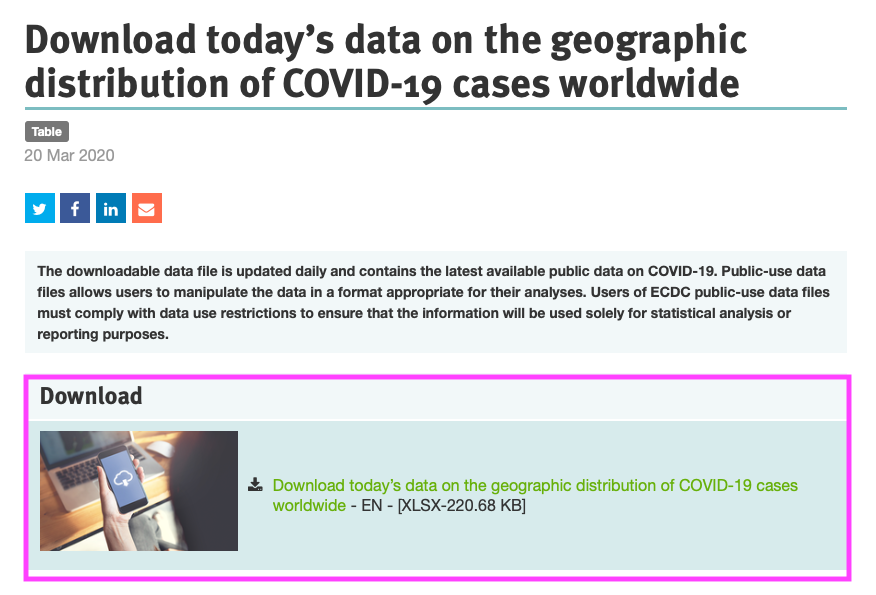
Source 1- ECDC, provides daily Covid data on a country level
- You need to download the CSV file
2. In the downloaded file delete highlighted columns
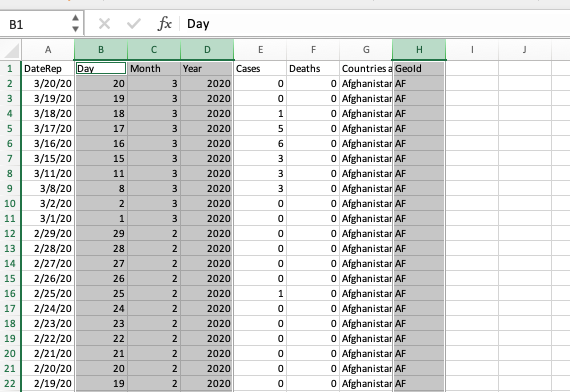
3. Afterward, search for the country you need using command+F
4. This source provides data on new cases and deaths
Source 2- ESRI
1. Shows only the total of reported confirmed cases, deaths, and recoveries. You can filter the data by either state or country.
2. Data is provided in a format of a JSON file
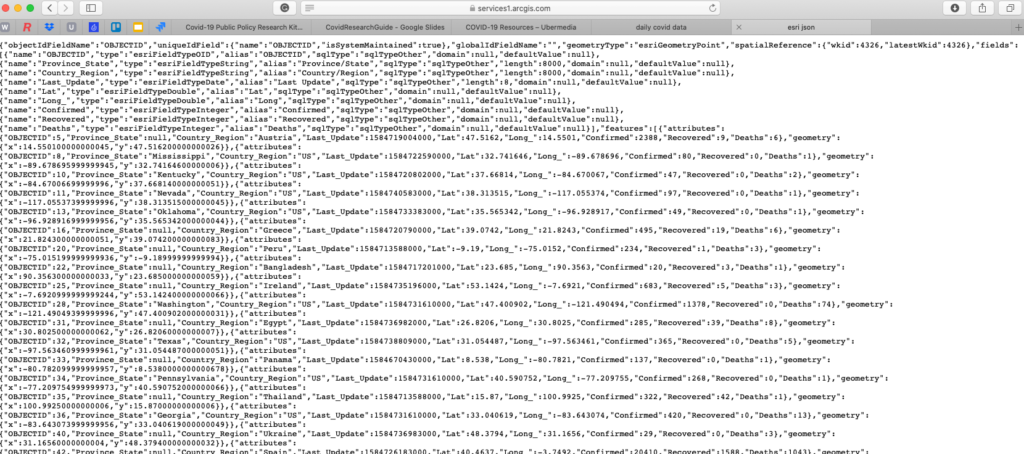
3. You can use this tool to convert the JSON to CSV format
4. Copy and paste the JSON to the highlighted field and click on Download CSV when the conversion process is done

5. The file will have a lot of columns, you will need the highlighted ones (if you need to filter and aggregate the data per country select column Q as shown in the screenshot below. In case if you need to filter the data per state select column P instead of column Q).
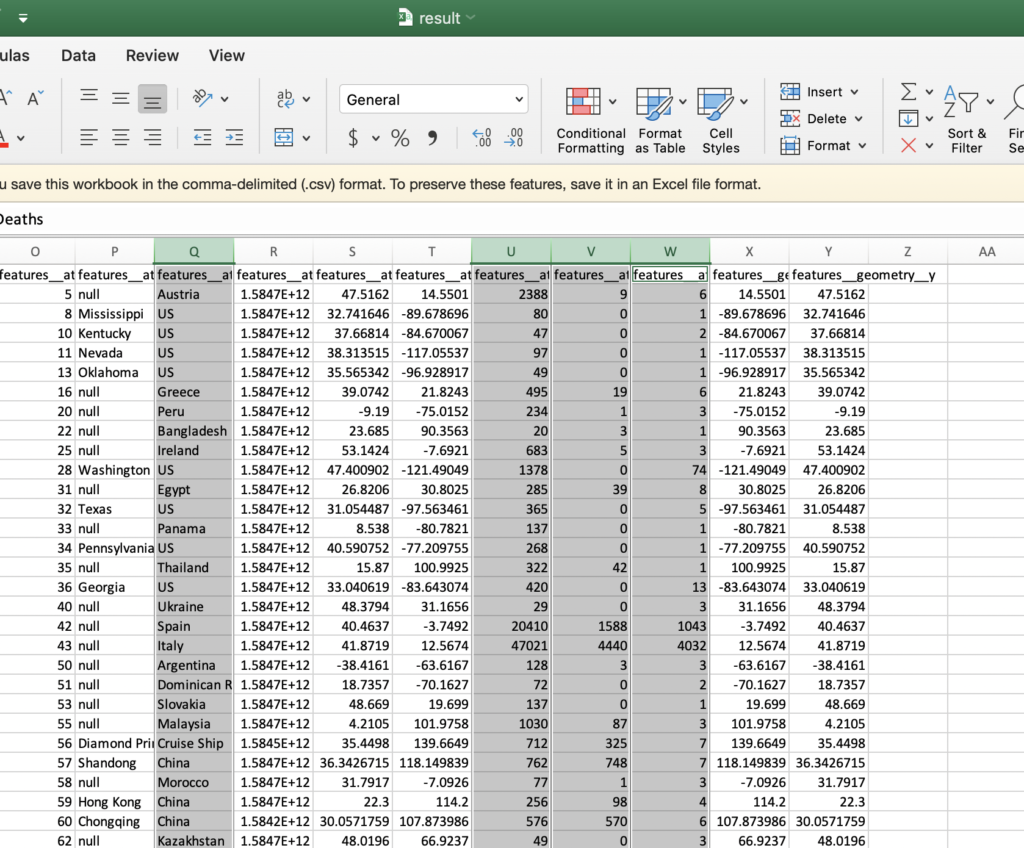
6. When you remove all of the irrelevant columns you will need to use the pivot tables
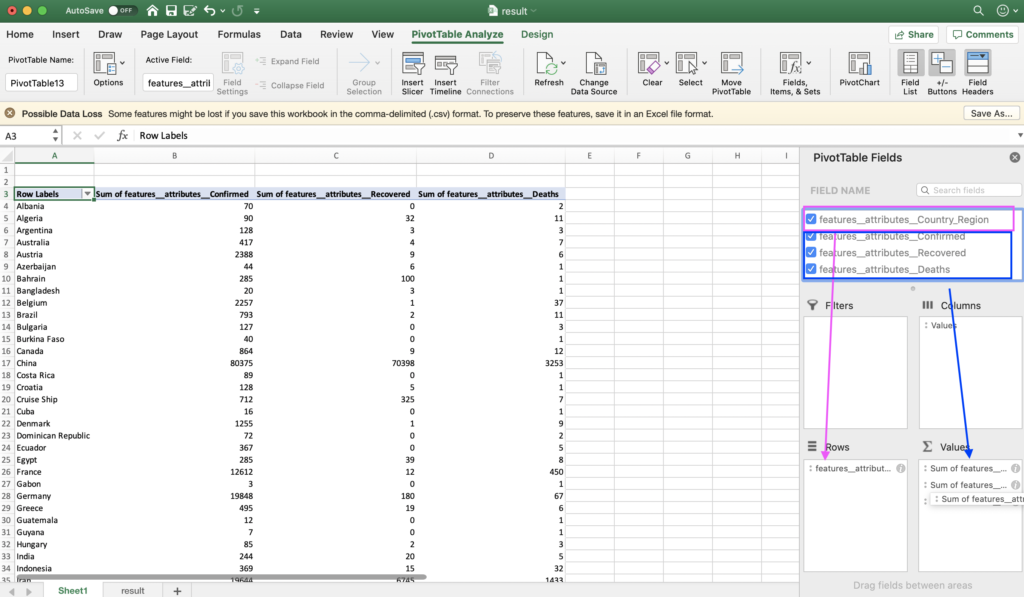
7. Drag country/ region (or state) to the Rows box and the rest of the data (cases, deaths, recoveries if needed) to the Values box
8. Now all of the data will be grouped by country (or state)
9. Unfortunately, this source doesn’t provide a daily breakdown of COVID data.
10. The workaround to log the daily breakdown is as follows:
11. Run the report and save or note the total count of new cases every day
12. Each day, subtract the previous day’s total from the new total to figure out the number of new daily cases
Source 3- Worldometers
- Provides daily Covid data on a country level
- For the US provides also break down on a state level
- Useful tool showing number of cases, new cases, deaths, recoveries etc.
Source 4- Data for LA
- This shows only the total of reported confirmed cases and deaths.
- Unfortunately, this source doesn’t provide a daily breakdown of COVID data.
- The workaround to log the daily breakdown is as follows:
- Run the report and save or note the total count of new cases every day
- Each day, subtract the previous day’s total from the new total to figure out the number of new daily cases
Source 5- Data for Kong County
- This shows only the total of reported confirmed cases and deaths.
- Unfortunately, this source doesn’t provide a daily breakdown of COVID data.
- The workaround to log the daily breakdown is as follows:
- Run the report and save or note the total count of new cases every day
- Each day, subtract the previous day’s total from the new total to figure out the number of new daily cases
Source 6- Data for Nashville
- This shows only the total of reported confirmed cases, recoveries, and deaths.
- Unfortunately, this source doesn’t provide a daily breakdown of COVID data.
- The workaround to log the daily breakdown is as follows:
- Run the report and save or note the total count of new cases every day
- Each day, subtract the previous day’s total from the new total to figure out the number of new daily cases
Source 7- Data for Boston
- This shows only the total of reported confirmed cases and deaths.
- Unfortunately, this source doesn’t provide a daily breakdown of COVID data.
- The workaround to log the daily breakdown is as follows:
- Run the report and save or note the total count of new cases every day
- Each day, subtract the previous day’s total from the new total to figure out the number of new daily cases
Source 8- Data for Miami-Dade county
- This shows only the total of reported confirmed cases and deaths per state and also per county.
- Unfortunately, this source doesn’t provide a daily breakdown of COVID data.
- The workaround to log the daily breakdown is as follows:
- Run the report and save or note the total count of new cases every day
- Each day, subtract the previous day’s total from the new total to figure out the number of new daily cases
Source 9- Data for Madrid
- Look for the link “Actualización…” and look for Madrid’s total
- This shows only the total of reported confirmed cases and deaths per city
- Unfortunately, this source doesn’t provide a daily breakdown of COVID data.
- The workaround to log the daily breakdown is as follows:
- Run the report and save or note the total count of new cases every day
- Each day, subtract the previous day’s total from the new total to figure out the number of new daily cases
Source 10- Data for Cincinnati
- This shows only the total of reported confirmed cases
- Unfortunately, this source doesn’t provide a daily breakdown of COVID data.
- The workaround to log the daily breakdown is as follows:
- Run the report and save or note the total count of new cases every day
- Each day, subtract the previous day’s total from the new total to figure out the number of new daily cases
Source 11- CSSE
- This shows the total of reported confirmed cases, deaths and recoveries per country
- Unfortunately, this source doesn’t provide a daily breakdown of COVID data.
- The workaround to log the daily breakdown is as follows:
- Run the report and save or note the total count of new cases every day
- Each day, subtract the previous day’s total from the new total to figure out the number of new daily cases
Source 12- NY Times, a source on github
- This shows only the total of reported confirmed cases US county
- Unfortunately, this source doesn’t provide a daily breakdown of COVID data.
- The workaround to log the daily breakdown is as follows:
- Run the report and save or note the total count of new cases every day
- Each day, subtract the previous day’s total from the new total to figure out the number of new daily cases
Azira copyright notice and disclaimer: No reproduction or use is permitted without Azira’s express written consent.