FR
FR JA
JA
How can mobile location data inform COVID-19 social distancing initiatives, retail recovery, and recreation reopening?
Background
Since our last blog post, a lot has changed. Most of the country has lifted Stay at Home orders and many are using a Phased Approach to opening Non-Essential businesses. While the debate over whether this State or date has flattened the curve enough to resume activity goes back and further, one thing is for certain: businesses have shifted their focus from survival to Recovery.
In the past few weeks, we’ve provided a glimpse as to how businesses can use mobile data to start their Recovery planning efforts. This week, we launched a new product, Azira’s COVID-19 Recovery Insights solution. This solution updates 30+ business, tourism, and market metrics daily for organizations of all sizes to develop strategies aimed at recovering from the coronavirus pandemic. Contact info
One of our recent webinars looked into how Georgia’s reopening could help inform what recovery looks like for public places, retail sectors, and restaurants in the wake of COVID-19. Specifically, we studied how consumer behavior changed right after reopening, how visitation from out-of-state tourists impacted the state,, and how geosocial block group segments can be combined with Azira’s social distancing metrics to evaluate whether communities’ interests and attitudes are any indications of whether or not they will be compliant with a stay at home orders In that webinar, we concluded that recovery would be a gradual process.
In this study, we will be using the Recovery Insights Solution to understand consumer engagement both nationally and in Georgia to better understand how things have progressed since reopening.
A National Perspective on Social Contact
- Metric: Close Contact
- Definition: Devices who are within 5 meters of another device within 5 minutes
- Scope: Aggregated devices across the nation
- Timeline: February 16, 2020 – June 5, 2020
Comparing Nationwide Social Contact Over Time
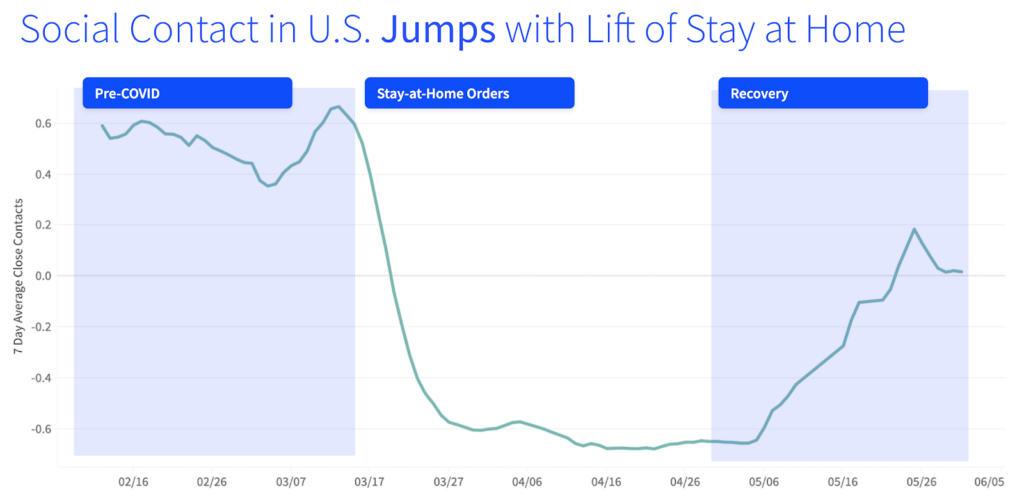
We looked at a seven day average of Close Contact, or how much interaction there is between devices, aggregated across the United States. The 0.0 line on the above chart represents “normalcy,” or the average Close Contact observed over time before COVID-19. Pre-pandemic, you can see what normal interaction looks like as people are social.
When stay at home orders were put in, everything closed, you see a dip in social contact. This was a verification of our data that when these stay at home orders were put in we were seeing a lot less social contact during this time.
In the recovery phase, we are seeing a jump in social contact. We are seeing some trends that we are going back to pre-covid times. It is starting to plateau a bit, it will be interesting to see if we will go to a new norm or if it will go back to before the pandemic
Measuring Visitation to Non-Essential Businesses by State
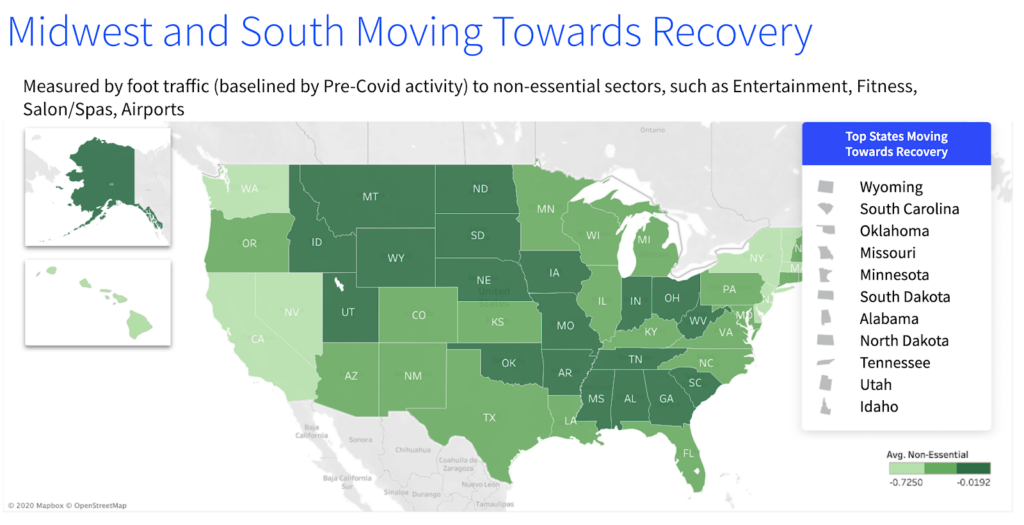
The midwest and southern states, represented in darker green, are moving closer towards recovery as consumers are visiting non-essential businesses (baselined by pre-pandemic activity) like entertainment, fitness, salon/spas, and airports.
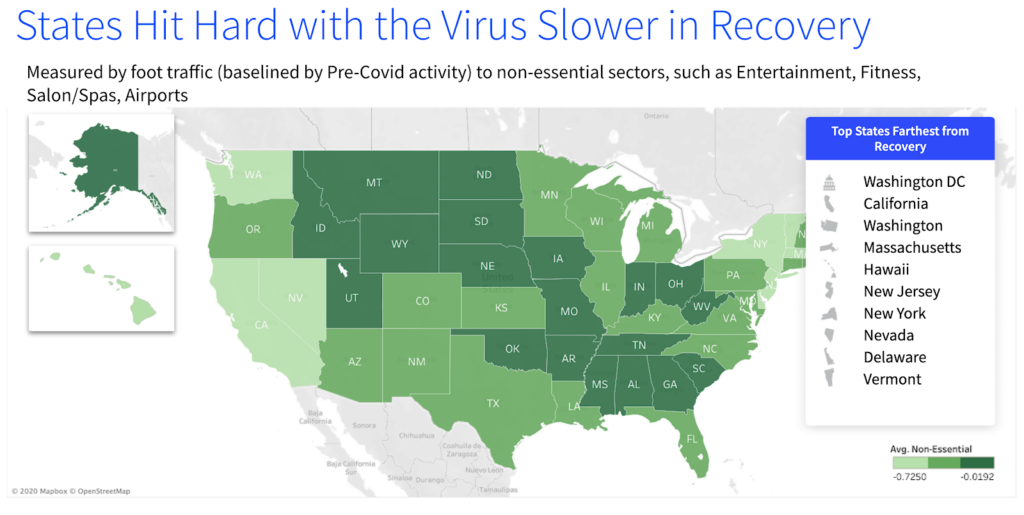
In contrast, the states that were hit hard with the virus and have later stay at home orders lifted, are a lot slower at recovery. Consumers are visiting non-essential businesses at a much lower rate when compared to their behavior prior to COVID-19.
Comparing Nationwide Consumer Behavior by Sector Over Time
- Metrics: QSR 7-day Trend, Grocery 7-day Trend, Non-Essential Retail 7-day Trend, Big Box 7-day Trend
- Definition: 7 day foot traffic visitation trends to QSR, Grocery, Non-Essential Retail, and Big Box sectors
- Scope: Aggregated sector visitation across the nation
- Timeline: May 1, 2020 – June 5, 2020
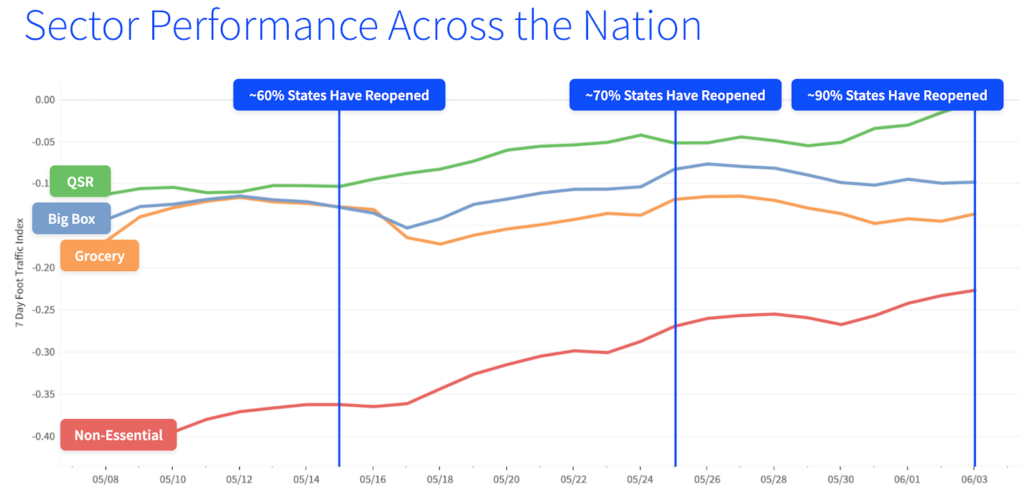
We looked at a seven day average of Foot Traffic Trend of select sectors, including QSR, Big Box, Grocery, and Non-Essential, aggregated across the United States. The 0.0 line on the above chart represents “normalcy,” or the average visitation observed over time before COVID-19. This analysis begins in May, when most states began lifting their Stay-at-Home orders.
When 60% of states lifted their Stay-at-Home orders, there was steady traffic to each sector, but the only measurable increase was in the Non-Essential sector. By Memorial Day weekend, 70% of states had opened and each sector began to increase towards normalcy. By the beginning of June, when 90% of states reopened, the QSR and Non-Essential sectors saw significant increases.
Understanding Georgia’s Trajectory using Recovery Insights
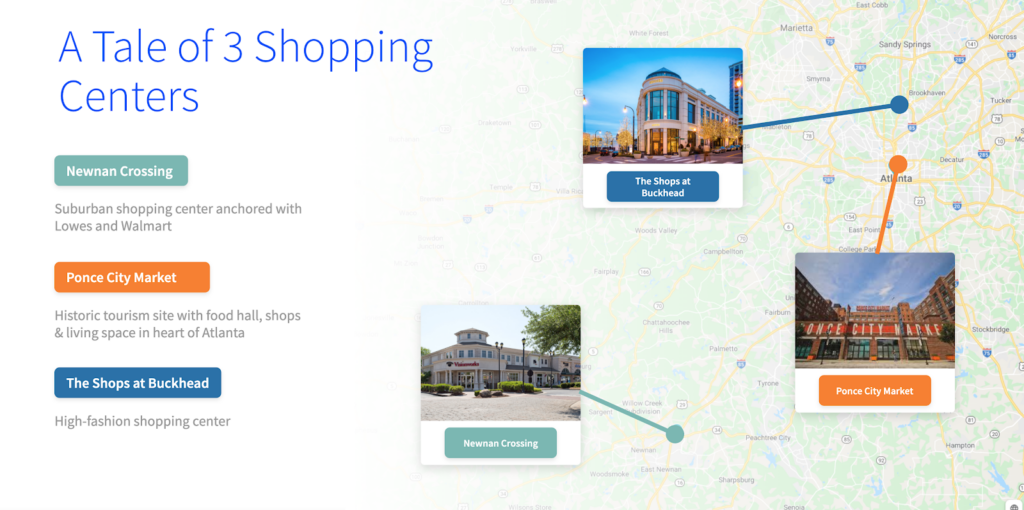
We analyzed three shopping centers in Georgia that have been impacted differently from the pandemic: a suburban shopping mall with “essential retail” anchors, a high-end designer shopping enter, and a tourist destination mall. While these shopping centers have all experienced changes as a result of the pandemic, the nature of their offerings has resulted in measurable and significant changes to the behaviors of their specific customers.
Newnan Crossing
Newnan, GA
This suburban shopping center contains both a Lowes and Walmart, two major retailers that maintained operation during the COVID-19 pandemic.
Ponce City Market
Old Fourth Ward District, Atlanta, GA
Ponce City Market is a mixed-use development located in a former Sears catalogue facility in Atlanta, with national and local retail anchors, restaurants, a food hall, boutiques and offices, and residential units.
Shops at Buckhead
Buckhead District, Atlanta, GA
This 9-acre planned mixed-use development has over 60 designer brands and restaurants located here, mostly higher end retail brands such as Hermés and Tom Ford.
Essential-Anchored Newnan Crossing Maintains Foot Traffic Normalcy
- Metrics: Individual Location 7-day Trend (Newnan Crossing, Ponce City Market, The Shops at Buckhead)
- Definition: 7-day visitation trend to a single retail location
- Scope: Newnan Crossing, Ponce City Market, The Shops at Buckhead
- Timeline: March 1, 2020 – May 25, 2020
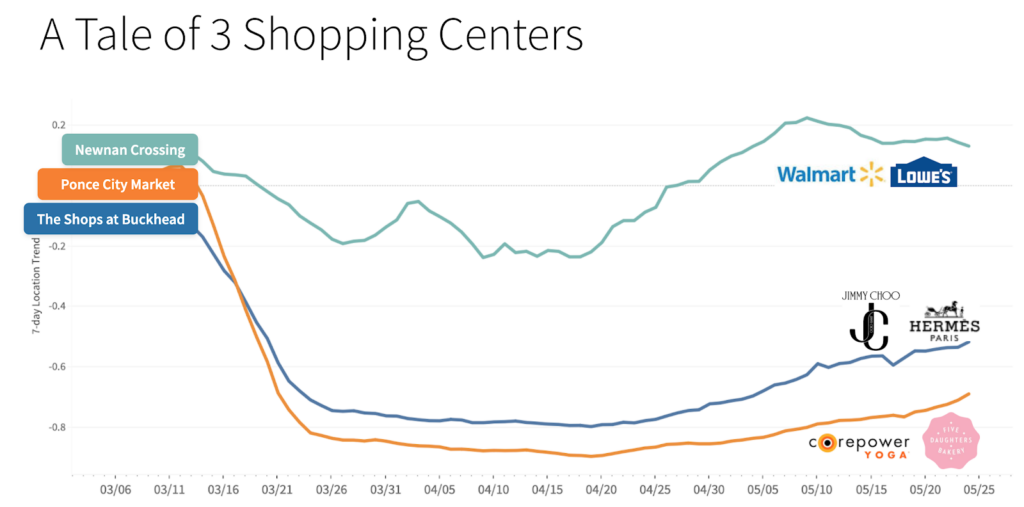
With ponce and buckhead, when covid happened, these two shopping centers took a plunge that is because what was at these shopping centers were basically places that were not allowed to open at this time
Visitation to Newnan Crossing is much closer to normalcy than The Shops at Buckhead and Ponce City Market. This is likely due to the fact that businesses in both The Shops at Buckhead and Ponce City Market were deemed “Non-Essential.”
Comparing Recovery to County and State Retail
- Metrics: Individual Location 7-day Trend; County Retail 7-day Trend; State Retail 7-day Trend
- Definitions: 7-day visitation trend to a single retail location; 7-day trend visitation for retail locations in the county (essential and nonessential); and 7-day trend visitation for retail locations in the state (essential and nonessential)
- Scope: The Shops at Buckhead, Morgan County, Georgia
- Timeline: March 1, 2020 – May 25, 2020
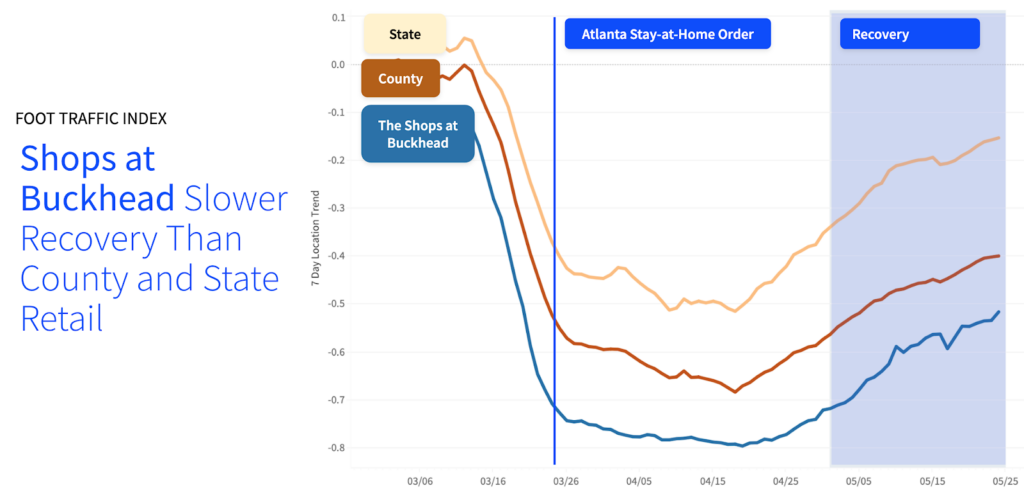
Compared to the aggregated visitation to retailers in Georgia State and Morgan County (the County that The Shops in Buckhead resides in), The Shops at Buckhead are much slower to return to normal.
Comparing Distance Traveled from Home to Retail Performance by Community Type
- Metric: Distance Traveled from Home Footprint 7-day Trend
- Definition: 7-day visitation trend in area covered by all devices
- Scope: The Shops at Buckhead, Newnan Crossing
- Timeline: April 28, 2020 – May 25, 2020
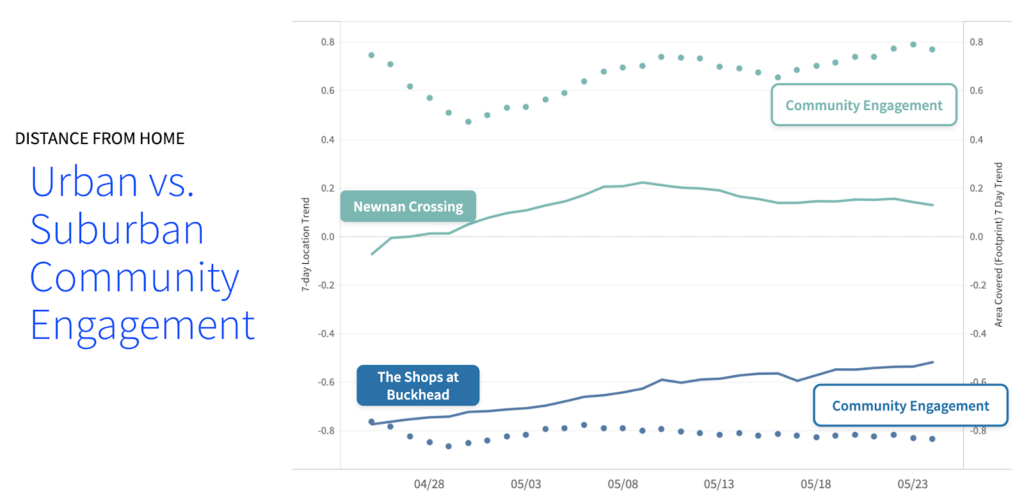
By comparing the Distance Traveled from Home in the communities surrounding Newnan Crossing and The Shops at Buckhead, you begin to see a stark contrast between the community engagement in the suburban area of Newnan vs community engagement in the more urban area of Buckhead, Atlanta. The solid lines represent the Individual Location 7-day Trend presented in an earlier section for both Newnan Crossing and The Shops at Buckhead. As in previous graphs, 0.0 represents normalcy in visitation.
Newnan crossing has gone above normalcy in visitation in the last couple weeks, and community engagement in Newnan has continued to rise. The Shops at Buckhead have yet to reach normalcy, and the surrounding community has not yet begun to rise.
By comparing behaviors to different types of communities, you can get a more nuanced sense of what is happening in your community. In these two examples, people in Newnan are traveling much further from home (above normal) than the Buckhead community.
Comparing Close Contact of Communities Surrounding Shopping Centers
- Metric: Mean # of close contacts per device
- Definition: Mean close contact events per device
- Scope: Buckhead, Atlanta, GA; Old Fourth Ward, Atlanta, GA
- Timeline: April 17, 2020 – May 22, 2020
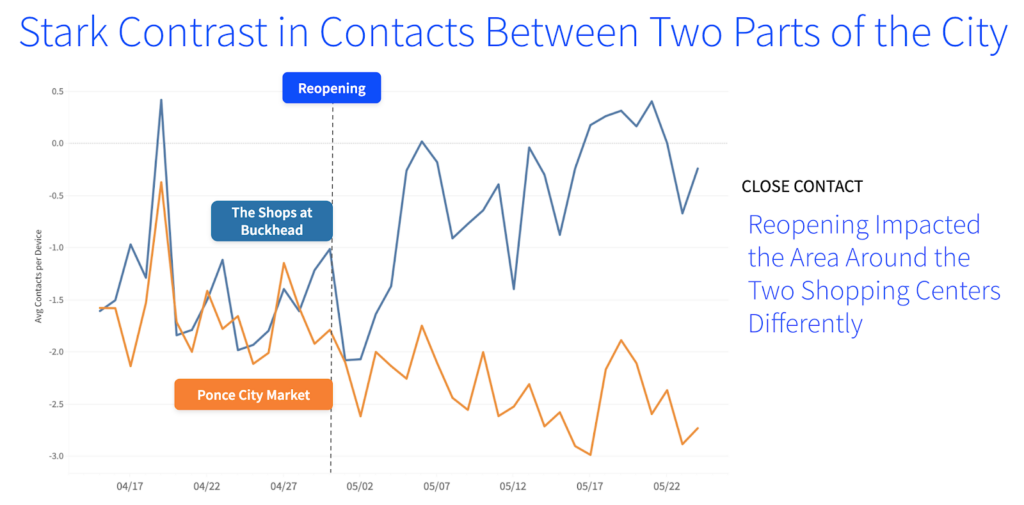
While the Distance Traveled from Home metric reveals that people are leaving their homes and traveling, it still begs the question that if they are leaving their homes, are they actually interacting with their communities? That is where the Close Contact data set can come in handy. It reveals the average amount of devices who were within 5 meters of another device within 5 minutes over a set amount of time for a given community.
While both Ponce City Market and The Shops at Buckhead are in the same city (Atlanta, GA), there are stark contrasts between how their communities (Old Fourth Ward and Buckhead, respectively) are interacting. Buckhead has an upward trend almost past normalcy. Whereas the community surrounding Ponce City Market is not yet experiencing that upward trajectory. The amount of engagement in those communities is very different.
There are multiple considerations that can be made using this data set. It can be used to gauge how quickly economic recovery can happen as well as the operational impacts regarding the safety of employees and customers in specific communities.
Conclusions
Across the nation, consumer engagement is increasing. We’ll be looking to see if that engagement will reach Pre-Covid-19 levels or if we’re in a new norm.
Comparing your store’s foot traffic trends to other economic sectors as well as metrics related to social engagement can help inform performance, as well as operations planning. These metrics are not easily predictable, so basing conclusions on data is a must.
Stark contrasts can be seen in social engagement and contacts in different areas of the same city. Distinguishing these areas can help businesses understand where to ramp up staffing and merchandising.