Key Insights:
Business Challenge:
Assess the impact of a major event on visitation patterns in Lake Elsinore, CA.
Results at Glance:
- Visitation peaked in March (~65 index) and returned to baseline post-event.
- Weekends saw significantly higher foot traffic, highlighting a preference for weekend visits.
Solution:
- Used Heartbeat reports to analyze visitation trends before, during, and after the event.
- Examined monthly and daily visitation data to identify spikes and patterns, including higher weekend traffic.
This tourism board measured the impact of an event, in terms of visitation, to a particular area.
Background:
From the end of February to the beginning of April 2019, an event occurred in the city of Lake Elsinore, CA. A tourism board was interested in seeing how visitation changed from February to May of 2019 and how that varied during the event.
Reports used:
- Heartbeat
How did visitation change in the designated area from February to May of 2019?

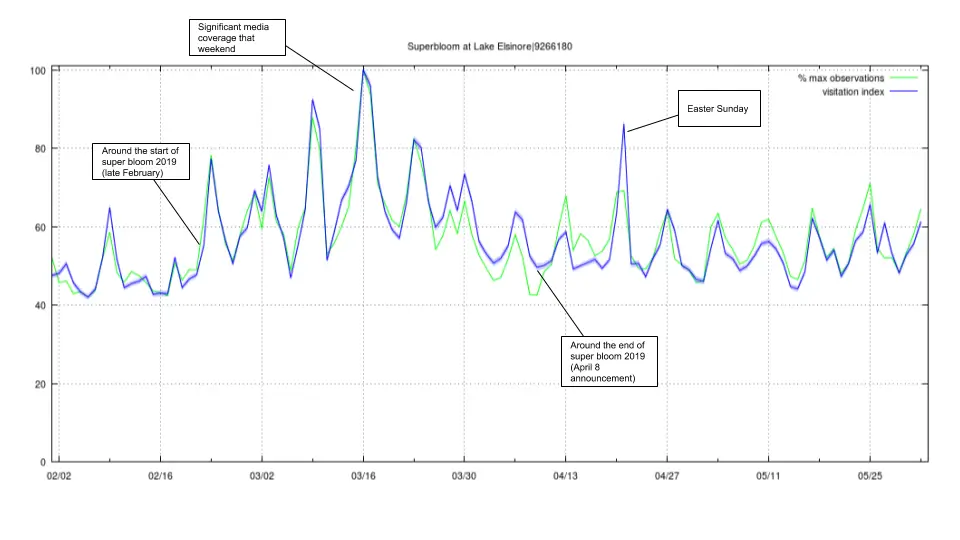
The Heartbeat report is a great way to explore the impact of an event on foot traffic in a study geography. From looking at this graph, we can see that there was an upward trend from late February to the middle of March when there was significant hype around the event. Visitation slowly went down as the excitement died down. Once the event ended, visitation went back to its pre-event levels.
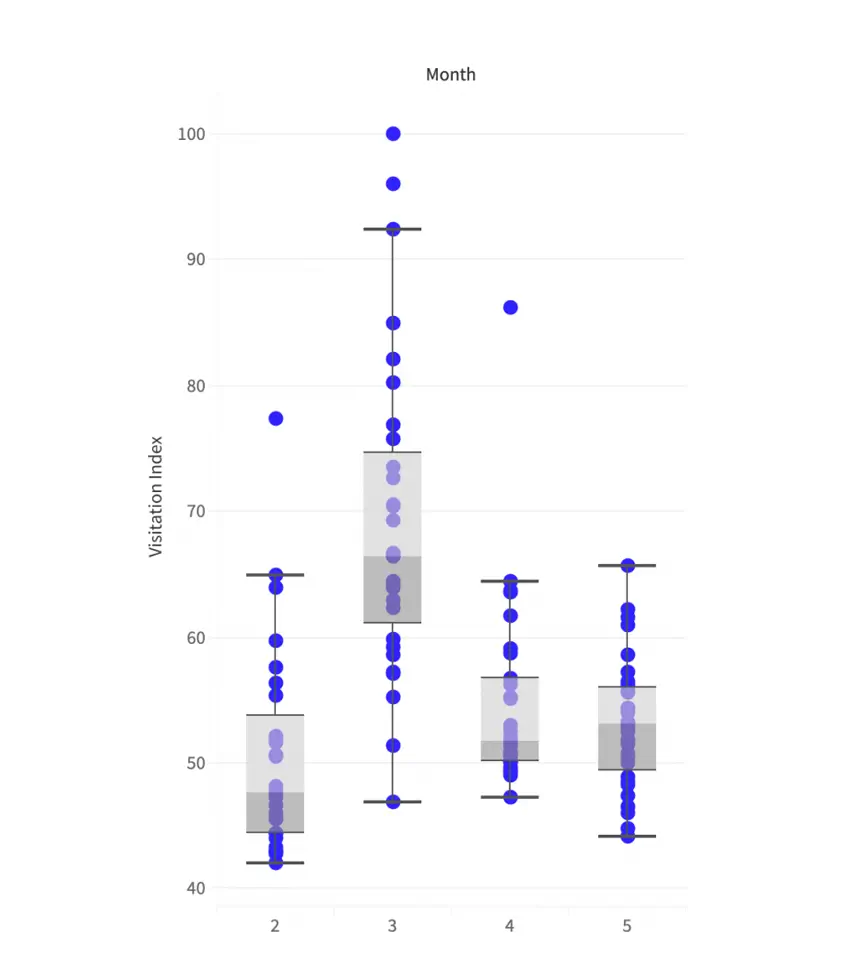
Superbloom at Lake Elsinore (Month)

This graph further highlights the impact that the event had on the area. From looking at a breakdown of visitation by month, the median visitation index in February, April, and May hovered around 50. However, there was a noticeable increase in the visitation index during March where the median visitation index was close to 65.
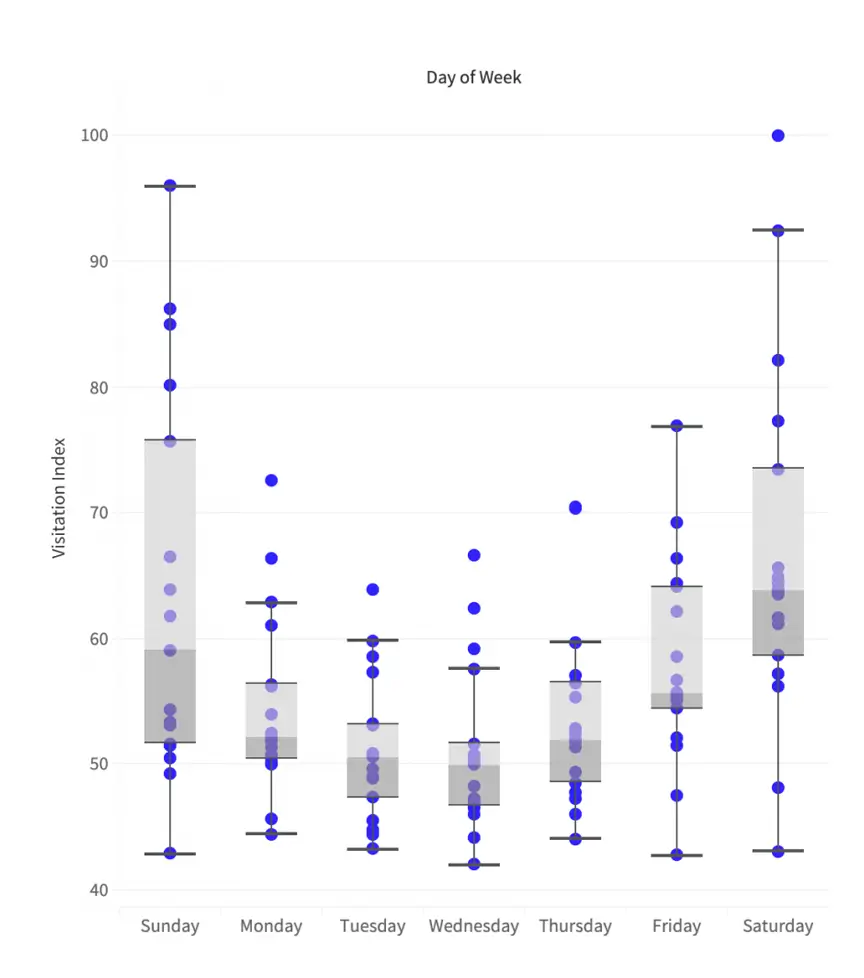
Superbloom at Lake Elsinore (Day)

The breakdown of visitation by day shows that the visitation index, on average, was higher on the weekends compared to the weekdays. This would indicate that more people would rather take a day trip to witness the event on the weekends rather than taking it during the weekdays. This is only one of many use cases for visitation patterns and foot traffic trends for locations.


