In the last few years, dining behaviors and what diners want have evolved significantly. And of all the dining experiences, the one impacted most dramatically was that of dining out at a restaurant. Restaurants in much of the U.S. were closed for indoor dining in response to surges in Covid-19 cases in 2020 and 2021. Outdoor dining provided a popular alternative, but that was dependent on favorable weather and ample space. As a result, dining in still hasn’t returned to pre-pandemic levels.
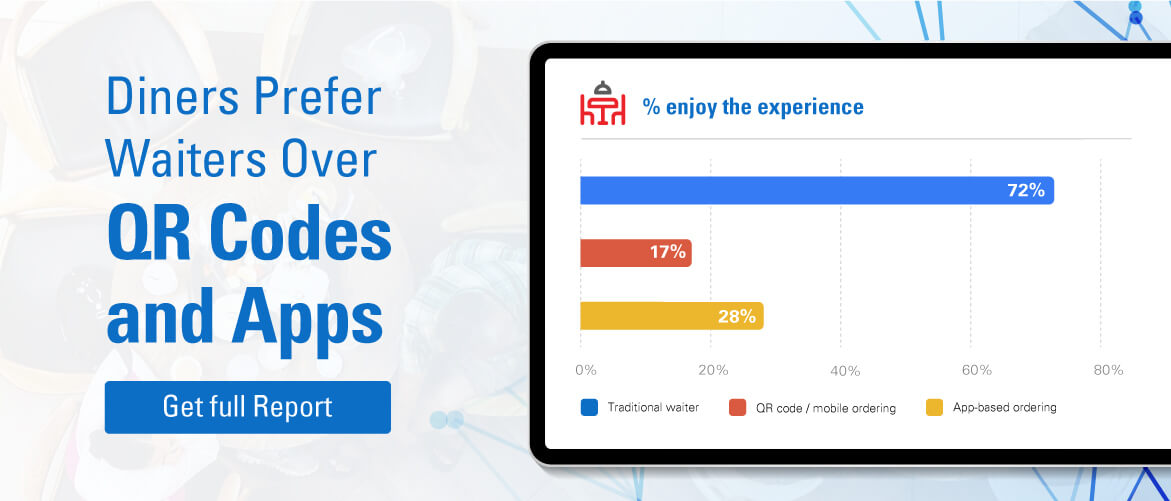
However, even as it’s taken time to recover, diners seem to crave the traditional restaurant experience. Azira’s recent study, The New World of Consumer Behavior: Restaurants 2022, found that nearly 72% of diners reported that they still enjoy and would prefer a traditional waiter experience where a waiter takes diners’ orders, brings them their food, and brings the check. This is one piece of a larger theme we identified, where people who are dining out want to go all out.
Dining Out and Going All Out
Although diners have not yet returned to pre-pandemic levels of eating out, it’s become clear that when they do go out, they have higher expectations for the experience. This is particularly true when sitting down to dine.
When dining out, 64% of diners reported that they’re looking for a certain type of food, 58% of diners reported that they want to celebrate a special occasion, and 43% also said they crave the ambience.
Top reasons to dine at a restaurant
Diners prefer a personal touch
This expectation also extends to the dining experience, and when dining in, it’s clear that diners want the traditional waiter experience. As previously stated, nearly 72% of diners reported that they still enjoy and would prefer a traditional waiter experience where a waiter takes diners’ orders, brings them their food, and brings the check.

Less favored, but still enjoyable experiences were established fast-casual interactions, such as ordering at a counter and interacting with a customer service representative. Also favorable were online and app-based ordering, which minimizes human interaction but also minimizes the amount of time needed to be in the restaurant premises itself.
The least favored ordering experiences had the least amount of human interaction and required diners to be within the restaurant premises. Approximately only 17% and 18% of diners enjoyed using QR codes and kiosks, respectively, in lieu of menus and counters. Most of the diners amenable to these experiences were between the ages of 18-44.
Read the report: The New World of Consumer Behavior: Restaurants 2022
Winning Strategies to Meet Diner Expectations
Although not every restaurant should prioritize the dining-in experience, those that do, should know that diners have high expectations for that experience. Even restaurants with large takeout footprints can take advantage of diners’ desire for a more personable experience. Some of the largest QSR chains (e.g. McDonald’s, Chick-fil-A) have specifically improved the drive-thru experience by bringing waiter-like touches to it to make it more personable. This has included multiple lines, dedicated representatives standing outside to take orders, and more– in some cases creating 70% of a store’s sales.
These growing expectations around the dining experience are just one side of a bifurcation in the dining experience. Consumers seek both convenience and personalized service, and how restaurants can deliver both depends on context. More than ever, restaurants need to understand their customers deeply to deliver on their expectations.
Study Methodology
This survey was conducted between February 24-27, 2022 with a total of 508 respondents in the United States, census-weighted by age, gender, income, and region. Additionally, Azira studied pulled human movement data for restaurant locations in Los Angeles, New York, Houston, Chicago, Miami, and San Francisco/Oakland between June 1, 2021 – May 31, 2022. Reports used included Azira Pinnacle’s Estimated Visits, Time Spent, Visitor Home and Work Locations Insights, as well as Azira’s Geosocial Affinity, Estimated Visitors, and Cross-Visitation Reports.


