FR
FR

Texas made it early to the reopening, as they relaxed restrictions in between May and June in order to revive the economy. Most of the businesses with the exception of Casinos and bars remained open during the subsequent months as well. Although bars opened up for a few days and then closed amidst rise in Covid cases.
Texas has seen continuous rises in Covid cases. There have been concerns whether reopening might have been happening too fast. Due to which certain businesses such as bars have been closed down and restaurants have been asked to reduce capacity. In the middle of all this, as Texas residents settle in ‘The New Normal’ how has their preferences shifted?
To understand the change in consumer trends, we studied the visitation pattern of multiple demographics across 2 different counties – Dallas and Harris during both pre and post-lockdown period.
To further our analysis, we also examined the footfall pattern and density index across various categories in the two counties.
Now, let’s see what the data has to say.
Personal care and groceries excel the priority list.
%age Change in Average Density by Category
The graph shows the change in average density across various categories on an aggregate level during the pre and post-lockdown phase.
After reopening, compared to most of the other states the highs were high and lows were low when it came to Texas. Probably, it was due to the fact that Texas experienced the shortest reopening.
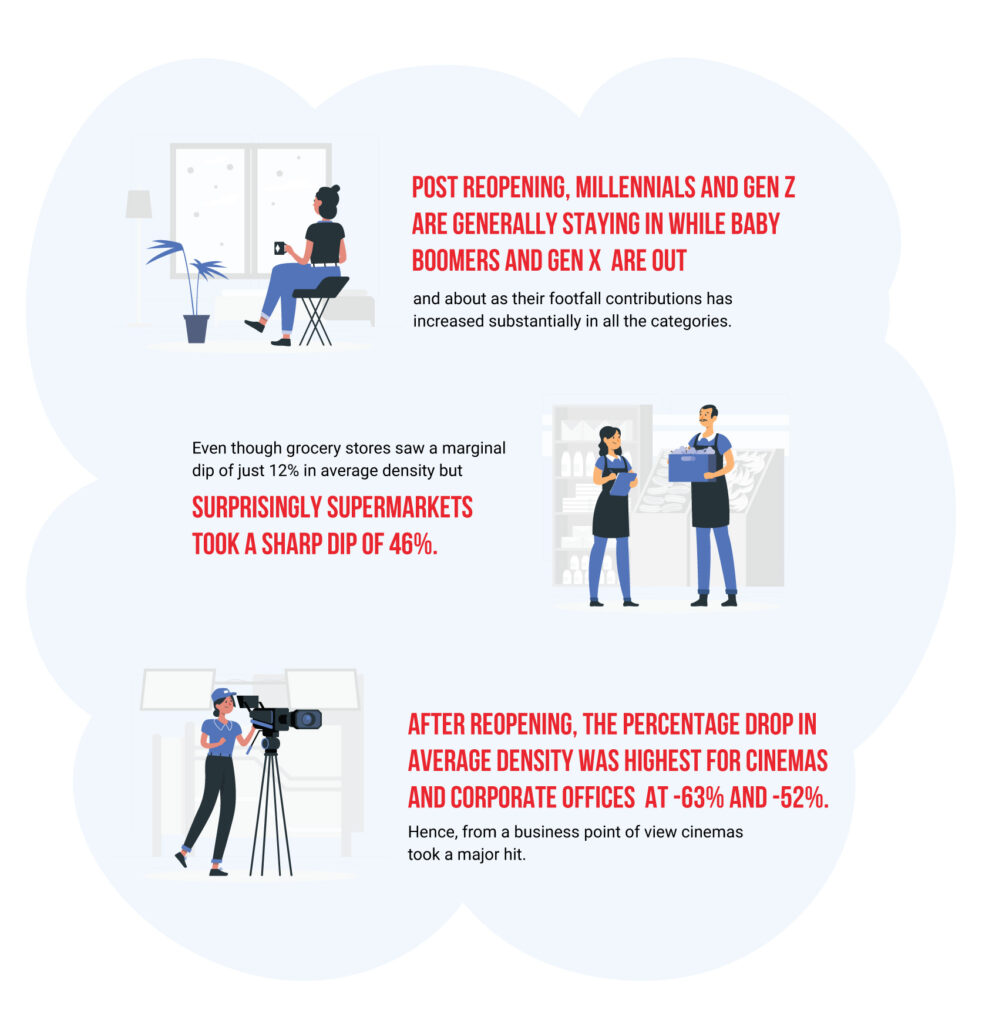
- After reopening, the percentage drop in average density was highest for cinemas and corporate offices at -63% and -52%. Hence, from a business point of view cinemas took a major hit.
- Even though grocery stores saw a marginal dip of just 12% in average density but surprisingly supermarkets took a sharp dip of 46%.
- Hair Salons which had seen a massive decline in most of the neighbouring states saw the second least decline in Texas.
In order to further our understanding of the residents behavior, we observed the county-wise distribution across these categories during both pre and post-lockdown period.
Density Index – pre-lockdown
Density Index – Reopening
The graph shows the county-wise change in average density across various categories during the pre and post-lockdown phase.
- In the pre-lockdown period, the highest density Index was observed at cinemas in Dallas (8.7) and restaurants in Harris county (7.9) with cinemas being a second favourite in Harris as well..
- After reopening, as the cases started to rise in June, cinemas in both Dallas and Harris county experienced the maximum decline in average density.
- In the post reopening period, the highest density Index was observed for grocery stores in Dallas and restaurants in Harris County.
- On an aggregate level, percentage change in average density index for essential services such as grocery stores experienced the minimum dip after reopening at -12%. In fact, in Dallas there was even an increase in density at grocery stores by 10%.
To further our analysis, we again looked at the county-wise change in average density on an aggregate level.
%age Change in Average Density by County
The graph depicts county-wise percentage change in average density.
Interestingly, an aggregate level drop in average density was almost the same for both the counties even though there was some disparity on a category level.
Millennials and Gen Z scale back on going out, even for the essentials.
Breakup by Age Group Pre Lockdown
Breakup by Age Group after Reopening
The graph shows the age-wise change in average density across various categories during the pre and post-lockdown phase.
Similar to all the other states that we have observed so far, while accounting the density to specific age groups, a stark contrast in pre and post-lockdown behavior was observed.
- In contrast to many of the other states, to begin with 45+ comprised maximum density in the majority of the categories. In the post reopening period, their density contribution increased even further.
- Major contrast was seen in the distribution for corporate offices in both the period as the density of 45+ increased substantially while those in the age group of 35-44 decreased to almost half of its pre-reopening density.
- Gen Z were hardly visiting hair salons in the pre-reopening period, however, in post-reopening their footfall contributions to hair salons increased substantially.
Neighbourhood mobility superseded long distance travels.
Break Up by Distance Travelled Before Lockdown
Break Up by Distance Travelled Post Reopening
The graph shows the break up based on distance travelled for various categories during the pre and post-lockdown phase.
- During the pre-lockdown period, Texans were mostly to travel longer than 3 miles to cinema halls, corporate offices and public transport.
- However, after reopening Texans preferred to travel less than 3 miles for all categories except corporate offices.
- Supermarkets, grocery stores and hair salons were the most preferred destinations within 3 miles.
Understanding whether this behavior is an immediate effect of the stay-at-home order or a long-term one is yet to be determined. Studying these visitation trends over longer periods of time can help brands stay relevant and plan for the future.
In case you missed our global analyses on the changing behavior of people in the real-world amid COVID-19, please download it here.
Disclaimer: The data is used to measure the impact on businesses and consumer behavior and is not an explanation for the infection rates. If you choose to reuse our analysis, please contextualize it and attribute the content to Azira. Azira’s data platform is privacy-by-design and the data is gathered from real-world signals in an anonymized and aggregated form.