FR
FR JA
JA

Washington reopened in a phased manner with capacity limitations. Some at 30% capacity, others at 15%, yet, most of the non-essential and recreational services opened their gates for the residents. Leisure spots such as state parks, fishing, hunting, golf courses were also allowed to resume operations.
With Covid-19 cases still on a rise, how are Washington residents responding to current reopening. Where are they going? What are they buying? Whether there is a shift in their behavior and what does this mean for businesses that are exploring the road to recovery?
To understand the residents behavior in detail, we studied the visitation pattern and demography of consumers across 4 counties – King, Yakima, Snohomish and Pierce in between June 1st and June 30th 2020. And contrasted it with their pre-lockdown behavior between March 1st and March 15th 2020.
To strengthen the analysis, we also measured the density index across various categories and the footfall pattern in these counties.
Let’s take the data into account now.
Whether Dine-in or Dine-out, sustenance is Washington’s priority.
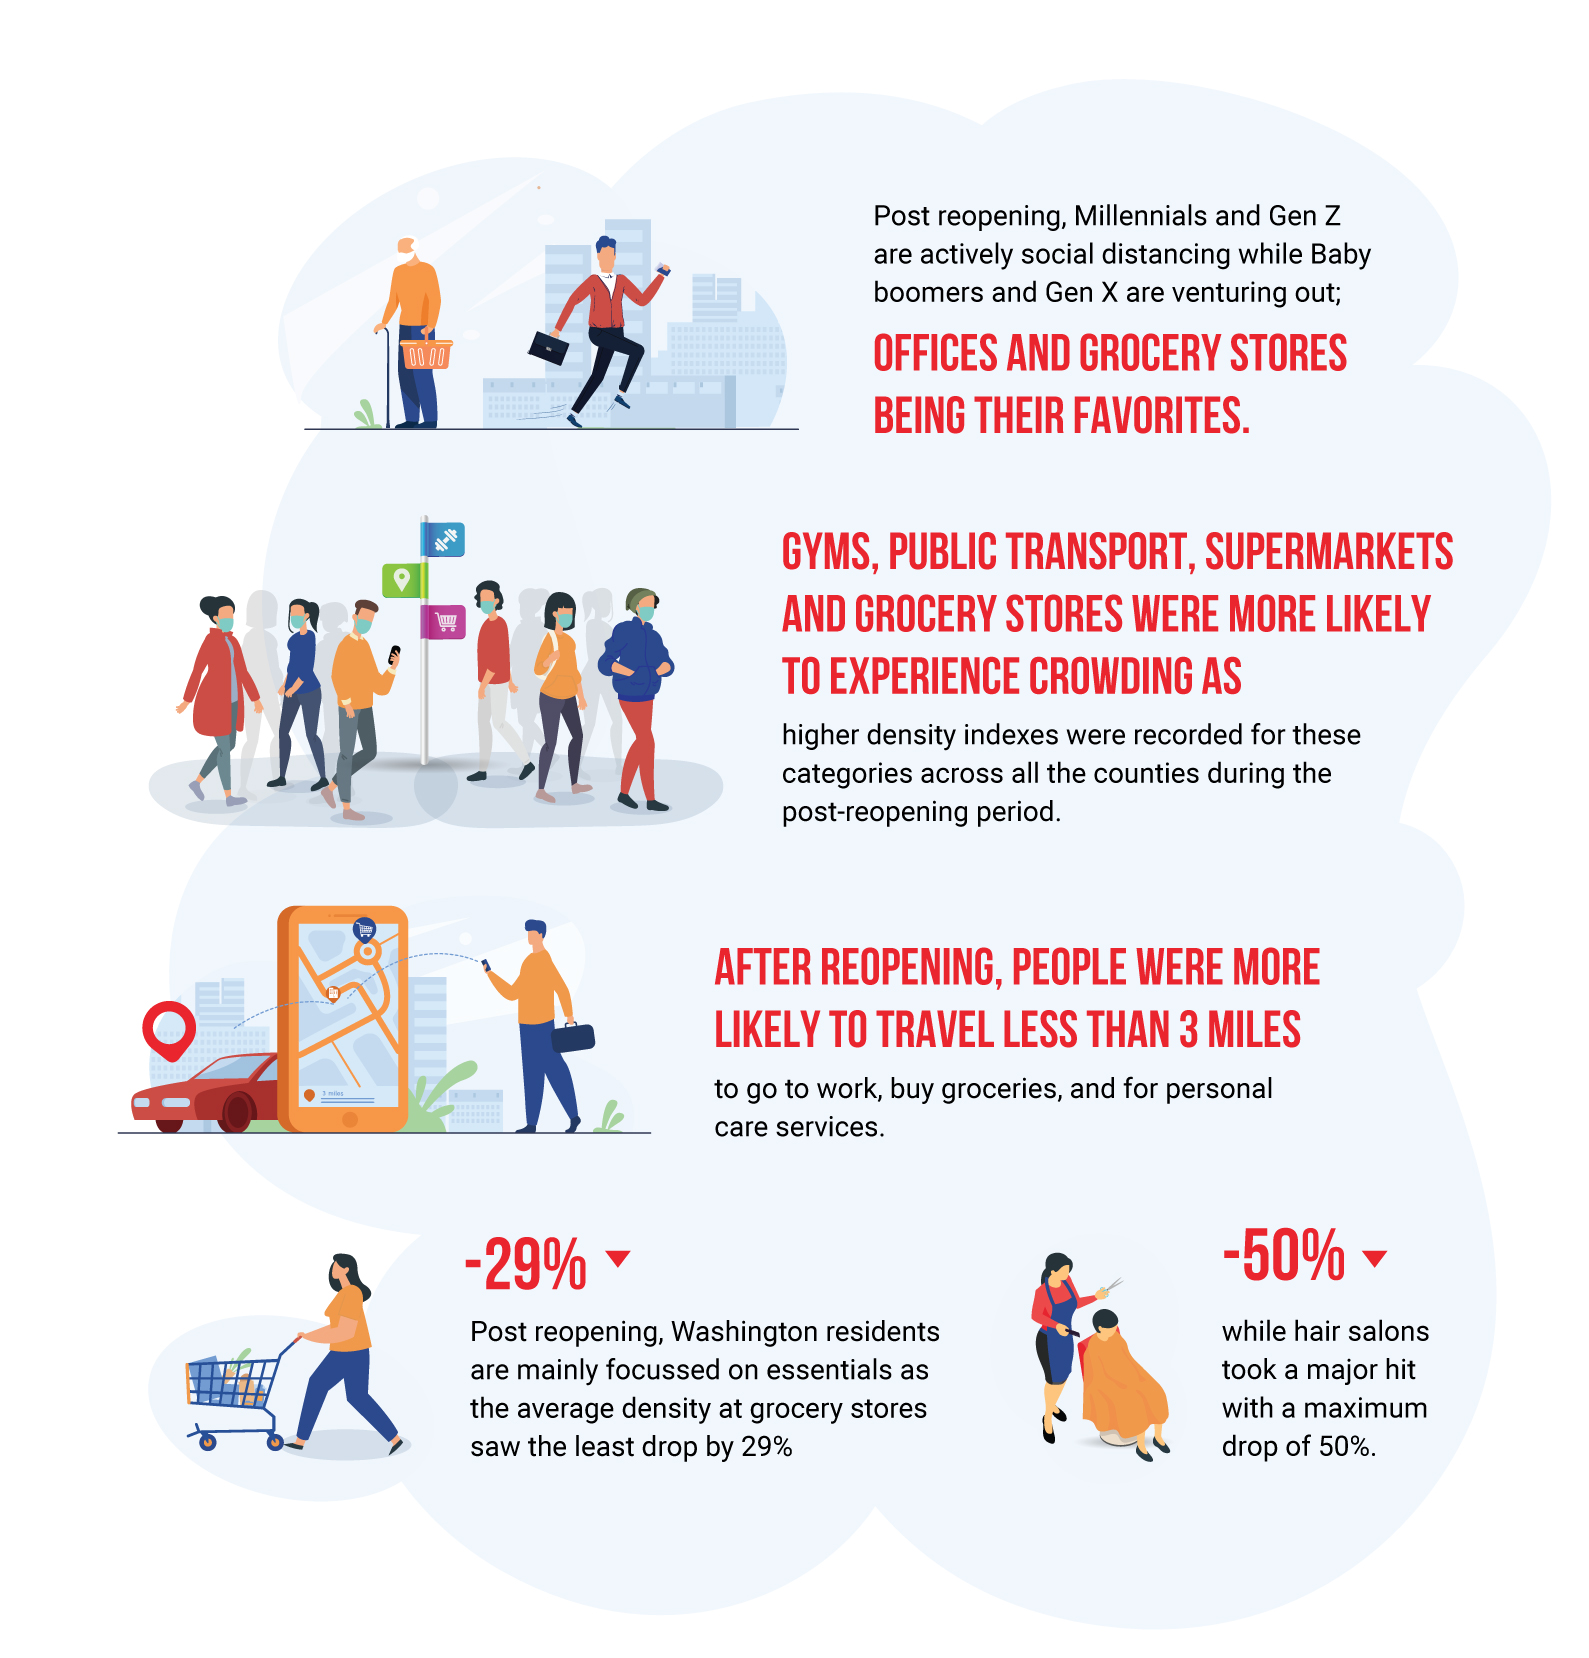
Following the stay-at-home order, average density saw a negative dip across all the categories with the highest drop of 50% at hair salon and the least drop of 29% at grocery stores.
%age Change in Average Density by Category
The graph shows the change in average density across various categories on an aggregate level during the pre and post-lockdown phase.
- Least dip in average density happened for grocery stores (29%) and restaurants (35%). Hence, sustenance continues to be the prime most activity for which residents venture out.
- Even though people are stepping out for essentials, still they are avoiding supermarkets which saw a footfall dip of 43%.
- Hair salons, corporate offices, public transport and cinemas witnessed a significant decrease in the average density. Given that these are diversified categories, Washington residents are trying to curb their movement in general.
To expand our analysis, we delved deeper by observing these categories in their county-wise distribution:-
Density index – Pre-Lockdown
Density index – Reopening
The graph shows the county-wise change in average density across various categories during the pre and post-lockdown phase.
- Gyms, supermarkets, grocery stores and cinemas had the highest density index in Pierce county. Residents’ preference was consistent with their pre-lockdown behavior.
- Cinemas have been picking up and may reach their pre-lockdown density in the coming months. On the other hand, restaurants, places of worship and hair salons have witnessed low-density index compared to other categories in both pre and post-lockdown phase across all the counties.
- Public transportation in King county experienced the maximum decrease in density index after reopening(-63%). However, grocery stores in Yakima county experienced a marginal increase in the density index.
In conclusion, the percentage change in the density index largely remained negative for all counties across all sectors.
Now, let’s look at the change in overall average density across counties.
%age Change in Average Density by County
The graph depicts county-wise percentage change in average density.
- Snohomish county experienced the minimum percentage drop in Average Density(-34%).
- On the other hand, King county experienced the maximum percentage drop in average density (-52%).
Millennials and Gen Z are staying in.
While attributing the density to specific age groups, a stark contrast in pre and post-lockdown behavior was observed.
- Millennials were one of the most outgoing groups across various categories during the pre-lockdown period. After lockdown, they are mostly staying in and avoiding restaurants, gyms, places of worship, supermarkets, etc which used to be dominated by them earlier.
- The share of foot traffic for Baby Boomers remained highest across all categories.
- Most striking different behavior was observed for the age group 35-44, who were least likely to visit most categories during the pre-lockdown period. However, post-lockdown, their foot traffic increased for almost all the categories.
Breakup by Age Group Before Lockdown
Breakup by Age Group after Reopening
The graph shows the age-wise change in average density across various categories during the pre and post-lockdown phase.
Distance doesn’t matter when it comes to Corporate Offices and Public Transportation Hubs.
- After reopening, people were more likely to travel less than 3 miles to go to work, buy groceries at supermarkets and grocery stores, and for personal services at hair salons.
- Residents were most likely to travel more than ten miles to visit corporate offices and public transportation hubs in both pre and post-lockdown period.
Break Up by Distance Travelled Before Lockdown
Break Up by Distance Travelled Post Reopening
The graph shows the break up based on distance travelled for various categories during the pre and post-lockdown phase.
Understanding whether this behavior is an immediate effect of the stay-at-home order or a long-term one is yet to be determined. Studying these visitation trends over longer periods of time can help brands stay relevant and plan for the future.
In case you missed our global analyses on the changing behavior of people in the real-world amid COVID-19, please download it here.
Disclaimer: The data is used to measure the impact on businesses and consumer behavior and is not an explanation for the infection rates. If you choose to reuse our analysis, please contextualize it and attribute the content to Azira. Azira’s data platform is privacy-by-design and the data is gathered from real-world signals in an anonymized and aggregated form.