FR
FR

Colorado was one of the first states to commence reopening, as the stay at home order expired on 26th April itself. Most of the businesses with the exception of Casinos and bars remained open during the subsequent months as well.
Largely, colorado has skipped the fresh spikes in cases after reopening. This has mainly been attributed to the fact that they embarked on a methodical and slow economic recovery process back in late April. As the residents came to accept ‘The New Normal’ how has their preferences shifted and what does it mean for businesses?
To deep dive into the behavior shift of Colorado’s residents, we studied the visitation pattern of multiple demographics across 3 different counties – Los Angeles, Riverside and San Diego – in between June 1st and June 30th 2020. Then compared it with their pre-lockdown preferences between March 1st and March 15th 2020.
To take our analysis further, we also observed the footfall pattern and density index across various categories in the above counties.
Now, let’s reflect on the data.
Health, sustenance and overall well being trumped the priority list.
%age Change in Average Density by Category
The graph shows the change in average density across various categories on an aggregate level during the pre and post-lockdown phase.
After reopening, the average density across multiple categories took a sharp decline as the residents continue to exercise caution by staying indoors.
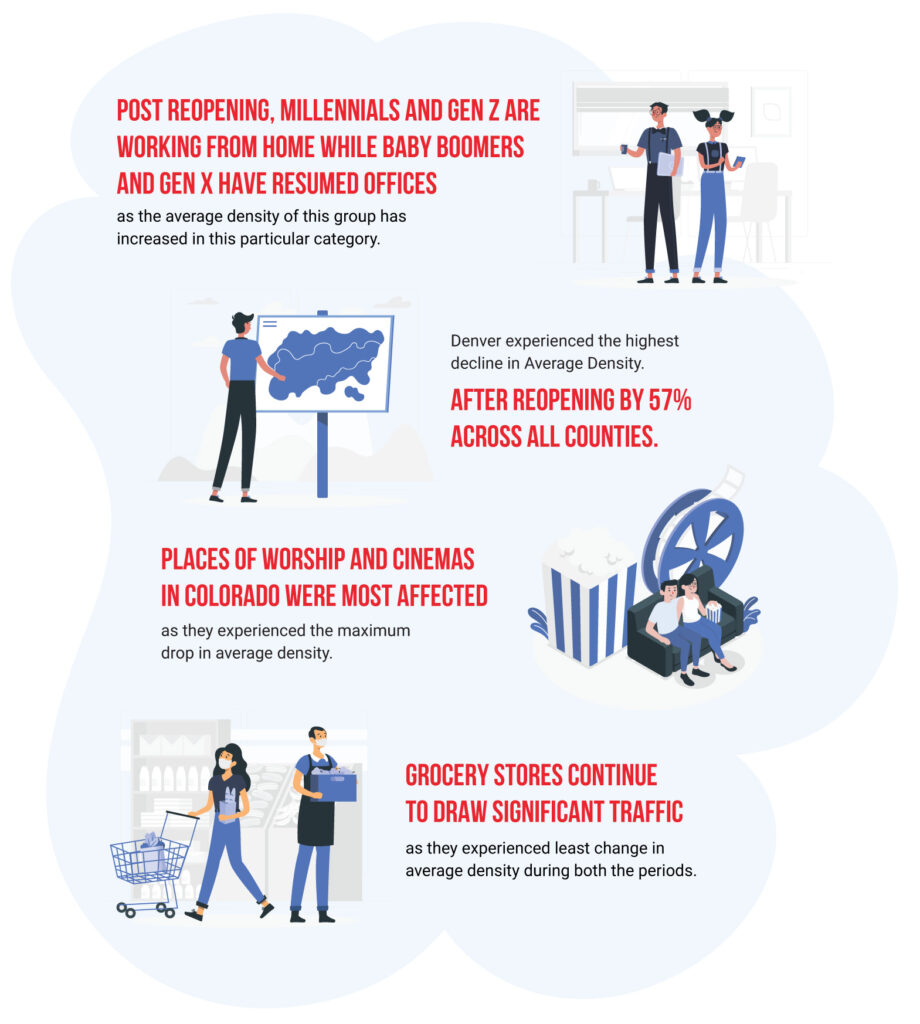
- After reopening, the percentage drop in average density was highest for cinemas and places of worship at -52% and -56%. Thereby, cinemas were the most affected business in Colorado.
- Sustenance and general well being continued to be a priority, given that grocery stores, supermarkets and gyms experienced the least dip in average density.
- Public transportation hubs also experienced close to 50% decline in average density as the residents avoided areas that might experience crowding.
In order to further understand residents behavior, we observed the county-wise distribution across these categories during both pre and post-lockdown period.
Density Index – pre-lockdown
Density Index – Post-Reopening
The graph shows the county-wise change in average density across various categories during the pre and post-lockdown phase.
- Only Denver saw a massive decline in density index across corporate offices. However, for Arapahoe and Adams county the decline was minimal.
- Interestingly, post-reopening corporate offices had the highest density index in absolute sense across all the counties. Hence, they were the places that were most likely to witness crowding.
- Public transport across all counties witnessed a density drop of almost 50% in between both the periods.
- Density index at hair salons remained the lowest for all three counties after reopening. Probably, the residents are avoiding high touch point areas.
To further our analysis, we again looked at the county-wise change in average density on an aggregate level.
%age Change in Average Density by County
The graph depicts countwise %change in average density.
Interestingly on an aggregate level, a parallel can be observed in terms of the density drop as it was seen on a category level.
- Denver saw the maximum percentage drop in average density at 57%.
- Both Arapahoe and Adams witnessed a percentage drop close to 40%.
Millennials are the model Citizens.
Breakup by Age Group Pre Lockdown
Breakup by Age Group after Reopening
The graph shows the age-wise change in average density across various categories during the pre and post-lockdown phase.
Similar to all the other states that we have observed so far, while accounting the density to specific age groups, a stark contrast in pre and post-lockdown behavior was observed.
- In the pre-lockdown period out of all the age groups Millennials were most likely to visit restaurants, gyms, public transport, hair salons, and cinemas. But after reopening they were least likely to be seen at these places indicating caution and avoidance of going out of the house.
- In the post-lockdown period, the majority of foot traffic across all the categories were dominated by 45+ year olds.
- Most striking different behavior was observed for the age group 35-44, who were least likely to visit most categories during the pre-lockdown period. However, post-lockdown, their foot traffic increased substantially for almost all the categories.
Neighbourhood mobility superseded long distance travels.
Break Up by Distance Travelled Before Lockdown
Break Up by Distance Travelled Post Reopening
The graph shows the break up based on distance travelled for various categories during the pre and post-lockdown phase.
- Post reopening, Colorado residents started avoiding long distance travels for corporate offices and public transportation hubs.
- For other categories, there was a slight dip in more than 10 miles category which was compensated by marginal increase in less than 3 miles category.
Understanding whether this behavior is an immediate effect of the stay-at-home order or a long-term one is yet to be determined. Studying these visitation trends over longer periods of time can help brands stay relevant and plan for the future.
In case you missed our global analyses on the changing behavior of people in the real-world amid COVID-19, please download it here.
Disclaimer: The data is used to measure the impact on businesses and consumer behavior and is not an explanation for the infection rates. If you choose to reuse our analysis, please contextualize it and attribute the content to Azira. Azira’s data platform is privacy-by-design and the data is gathered from real-world signals in an anonymized and aggregated form.