FR
FR

How can communities use human movement data to identify homeless encampments and inform resource allocation for hospitals, social services, housing, and more?
Background
“A new study puts the risk homeless individuals face in stark terms: It estimates that nearly 2,600 homeless people in the Los Angeles area alone will need to be hospitalized for COVID-19, and about 900 of them will require intensive care. The data shows how an outbreak in this vulnerable population could strain an already fragile hospital system.
If that many homeless people do indeed stream into local hospitals in the coming weeks, it could lead to increased competition among all patients for beds and ventilators. Officials have said California has far fewer of both than will be needed in coming weeks as hospitals fill up with the sick.
Homeless people, who are more likely to have underlying health conditions and weakened immune systems, often from living on the streets, are at a higher risk for developing severe forms of COVID-19 than the general population.” (Source)
There are on average 53,000 homeless in LA each night, with 44,000 of them unsheltered. There are only 18,000 shelter beds in LA on a given night. As standalone shelters fill and turn away homeless, where do those people go? What hospitals are at risk of overcrowding due to unexpected numbers of homeless patients otherwise unaccounted for?
94% own a cell phone, typically a smartphone, and 85% use it daily. Aggregated human movement data associated with likely homeless devices can be used to better understand a population of people otherwise unaccounted for by official sources.
Objective
By looking at the aggregated human movement data associated with those devices, we can better understand where homeless populations congregate, how they move throughout the city, and what city officials can do to better allocate temporary shelters, medical supplies, public health messaging and more to combat the spread of COVID-19.
Methodology
Identify likely homeless devices
Identify devices consistently seen at official shelters and known homeless encampments between 11pm and 5am. Study locations included:
Official Shelter: The Midnight Mission
601 S. San Pedro Street Los Angeles, CA 90014
“The Midnight Mission has been at [the] downtown location since 2005. Located at the heart of Skid Row, this location makes [The Midnight Mission] a central beacon of service to the Skid Row community.
[The] DTLA location includes [the] Men’s and Women’s Crisis Bridge Program, Healthy Living Program, Downtown Courtyard Services Program, a library, a barber shop, and hosts all of [the] With A Mission programs.” (source)
Encampment: Selma Avenue
Between N Highland Blvd and N Cahuenga Blvd, Hollywood, CA 90028
Selma Avenue in Hollywood is a consistent location for the city’s homeless. There are multiple homeless services nearby, including the Blessed Sacrament Food Pantry, LA Youth Network, The Center, and PATH – Hollywood, but limited official shelters.
Analyze movement patterns
Once devices are identified as “likely homeless,” we then analyzed changes in their location over time.
Insights
Likely homeless devices were spread out over the city prior to COVID-19
We analyzed the movement of homeless devices 4 weeks before and 4 weeks after March 16, the day LA county’s major public school systems suspended in-person teaching, causing many students and their parents to stay home.
On March 19 both LA’s mayor and the governor of California issued a “Safer at Home” order — calling for the closure of non-essential businesses in Los Angeles.This was a watershed moment in the middle of an otherwise gradual immobilization of the general population of the county.
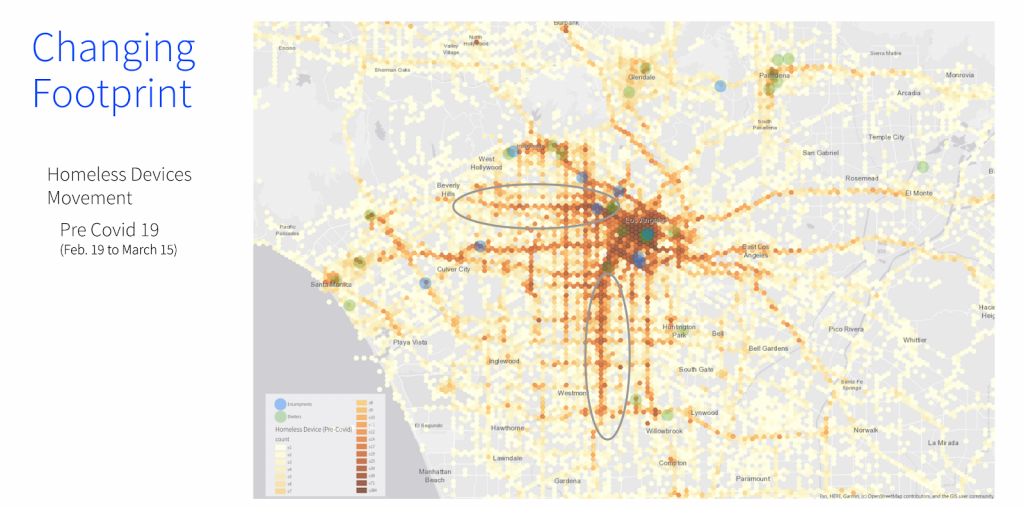
This first map shows where the devices we identified as belonging to the homeless community were located on or before March 15. Darker colors indicate a greater number of devices within a unit of area. The blue markers are for shelters.
As you can see, there is a lot of activity in and around the downtown LA area, especially around Skid Row. There is also activity along major public transportation arteries that link downtown LA to the southern and western parts of the county where medical points of service can be found. Those are highlighted with the large open ovals.
It’s interesting to note how much dispersal we see in this map and how far these devices are traveling back and forth between various neighborhoods. Like all Angelinos, homeless Angelinos are very mobile.
As COVID-19 increases in LA, likely homeless devices gather around homeless shelters in Downtown
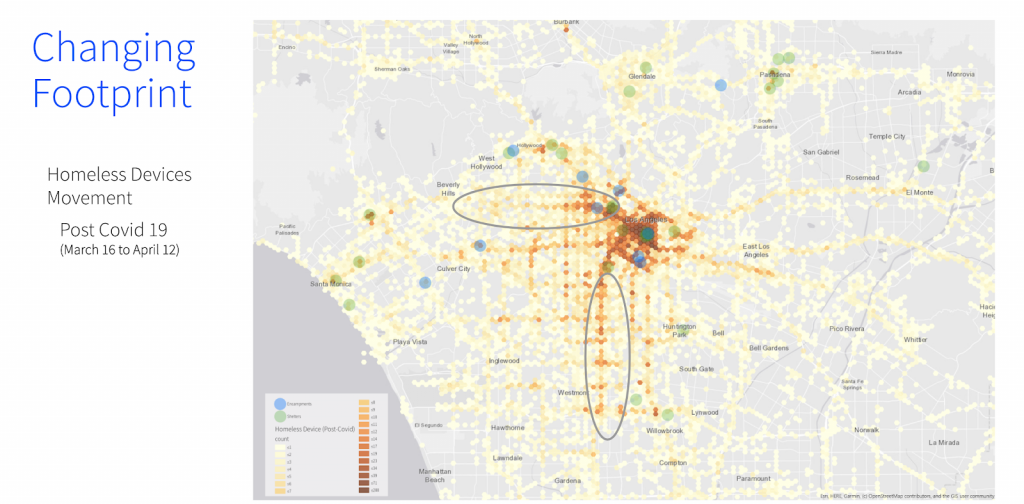
Now compare this to the map of devices after March 16 “Post COVID-19.” We can see that dispersal has grown much smaller. The major roadways that were highlighted previously have faded and the homeless traffic is now more concentrated in Downtown Los Angeles.
Temporary homeless shelters see influx of likely homeless devices
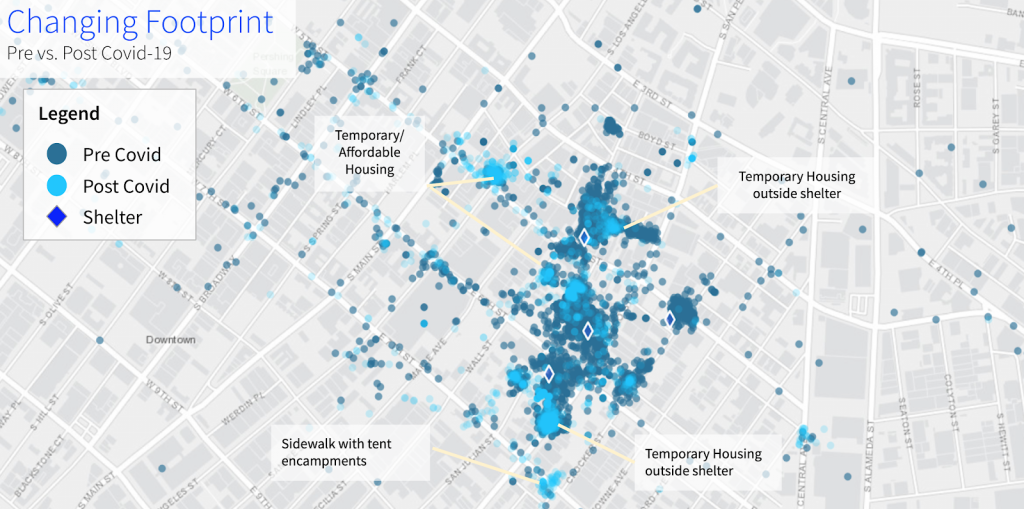
Let’s zoom in on Downtown LA. We can really see the change of mobility. The darker blue points are observed homeless device locations before March 16, and the light blue ones are observed after March 16. Post shelter in place, the movement of the devices is concentrated around shelters, maybe because many businesses around downtown LA closed, and traffic decreased, and homeless individuals had less cause to travel to those now quiet areas.
This is critical to understand, because this increased concentration has the potential to make this already-vulnerable population even more susceptible to becoming a covid hotspot. As individuals group together into a smaller geographic area, they have less opportunity to practice social distancing.
Conclusion
Identifying homeless populations to inform city-wide resource allocation
So bringing this back up to a county level, mobile location data can be very instructive to gain an understanding of the movements and behaviors of the homeless population in this time of pandemic.
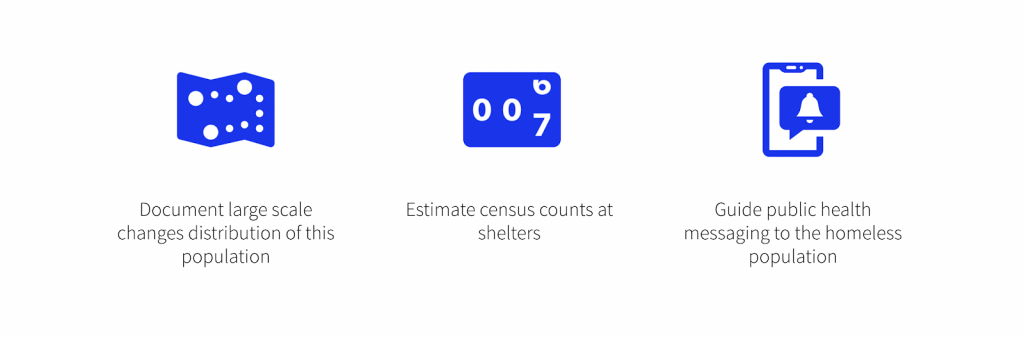
Specifically the data can
- Document large scale changes in the geospatial distribution of this population for instance, by
- Mapping the new footprint of the shelter system
- Measuring social distancing with/among likely-homeless devices, something we’ll talk about later in the presentation.
- Compute census counts at given shelters, including how many homeless devices are turned away and where they end up.
- And guide public health messaging to the homeless population.