FR
FR JA
JA

Georgia began reopening in May itself, as no strict stay-at-home policy was implemented and all the categories were reopened quickly. Georgia experienced an upward trend in the coronavirus cases with the highest reported cases in Gwinnett and Fulton counties.
Amidst such chaos, as Georgia residents settle in ‘The New Normal’ is there a change in their consumption preferences?
To understand the change in consumer trends, we studied the visitation pattern of multiple demographics across Gwinnett and Fulton counties during both pre and post-lockdown periods.
To further our analysis, we also examined the footfall pattern and density index across various categories in the two counties.
Now, let’s allow the data to speak for itself.
Personal-care and sustenance remain a top priority.
% change in Average density by category
The graph shows the change in average density across various categories on an aggregate level during the pre and post-lockdown phase.
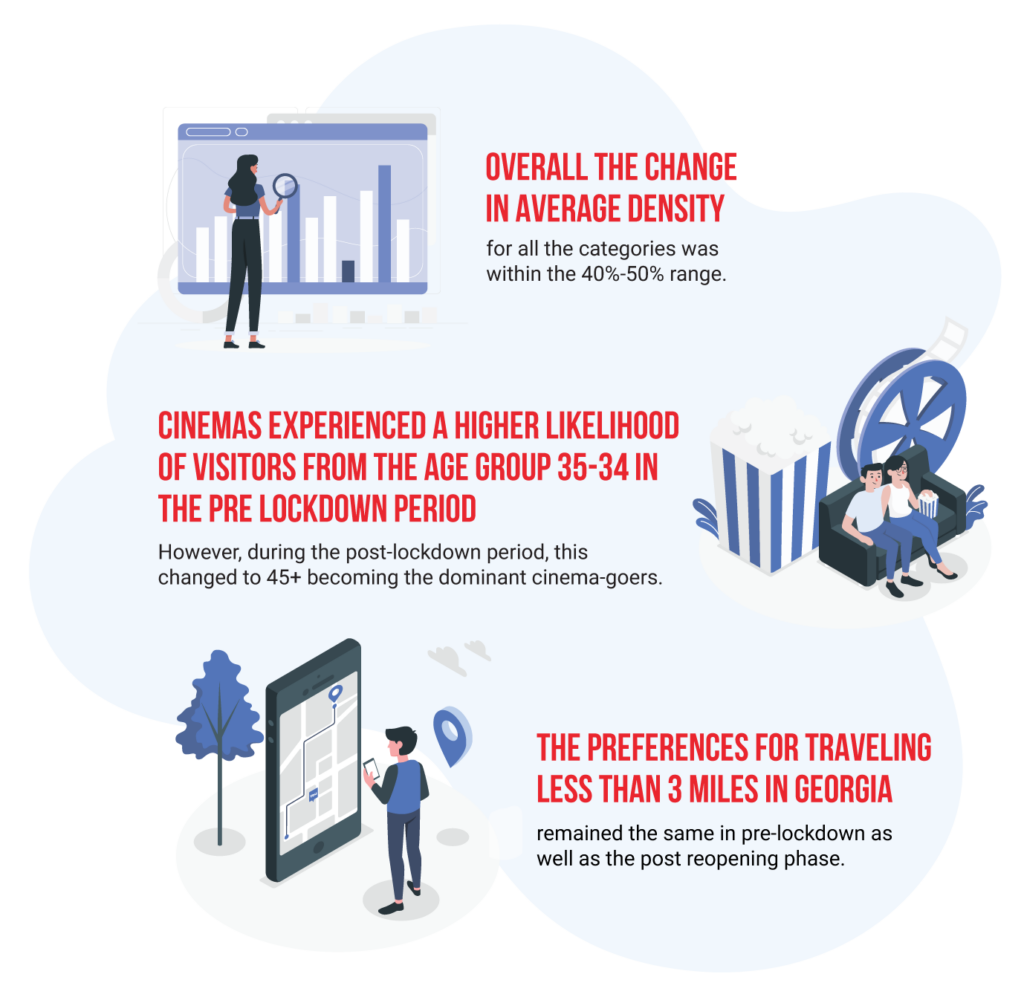
- Overall the change in average density for all the categories was within the 40%-50% range.
- Gyms, grocery stores and hair Salons experienced the least dip in average density. Whereas restaurants and public transportation hubs experienced the maximum amount of dip in their average density.
In order to further our understanding of the residents’ behavior, we observed the density index across these categories during both pre and post-lockdown periods.
Density index – Pre-Lockdown
Density index – Reopening
The graph shows the county-wise change in average density across various categories during the pre and post-lockdown phase.
- In both pre-lockdown and post-reopening periods, density indexes across various categories were a mirror image of each other with a scaled-down factor.
- After reopening, as the cases started to rise, corporate offices and cinemas saw a massive decline in density index.
- In the post reopening period, the highest density Index was observed for cinemas in Gwinnett county and public transportation hubs in Fulton county.
To further our analysis, we again looked at the county-wise change in average density on an aggregate level.
%age Change in Average Density by County
The graph depicts countywise percentage change in average density.
At an aggregate level drop in average density was way higher for Fulton (50%) compared to Gwinnett county(37%).
When it comes to stepping out after reopening, Baby Boomers take a lead.
Break Up by Age Group Before Lockdown
Break Up by Age Group After Reopening.
The graph shows the age-wise change in average density across various categories during the pre and post-lockdown phase.
- Baby boomers were most likely to visit public transportation hubs in the pre-lockdown period. However, they were more likely to visit grocery stores after reopening.
- Cinemas experienced a higher likelihood of visitors from the age group 35-34 in the pre-lockdown period. However, during the post-lockdown period, this changed to 45+ becoming the dominant cinema-goers.
Narrowing the travel to Neighbourhood.
Break Up by Distance Travelled Before Lockdown
Break Up by Distance Travelled Post Reopening
The graph shows the break up based on distance travelled for various categories during the pre and post-lockdown phase.
- Breakup by distance traveled during both the periods across all the major categories remained almost the same.
Understanding whether this behavior is an immediate effect of the stay-at-home order or a long-term one is yet to be determined. Studying these visitation trends over longer periods of time can help brands stay relevant and plan for the future.
In case you missed our global analyses on the changing behavior of people in the real-world amid COVID-19, please download it here.
Disclaimer: The data is used to measure the impact on businesses and consumer behavior and is not an explanation for the infection rates. If you choose to reuse our analysis, please contextualize it and attribute the content to Azira. Azira’s data platform is privacy-by-design and the data is gathered from real-world signals in an anonymized and aggregated form.