FR
FR JA
JA

Stay at home order in Arizona expired on May 15, following which most of the categories reopened. However, the cases in Arizona started rising multi-folds with Maricopa county reporting the highest number of cases.
Amidst such uncertainty, as Arizona residents settle in ‘The New Normal’, we analyzed if their consumption preferences remained the same.
To understand the change in consumer trends, we studied the visitation pattern of multiple demographics across Maricopa county during both pre and post-lockdown period.
To further our analysis, we also examined the footfall pattern and density index across various categories in the two counties.
Now, let’s see what the data has to say.
Work from home is ‘The New Norm’.
%age Change in Average Density by Category
The graph shows the change in average density across various categories on an aggregate level during the pre and post-lockdown phase.
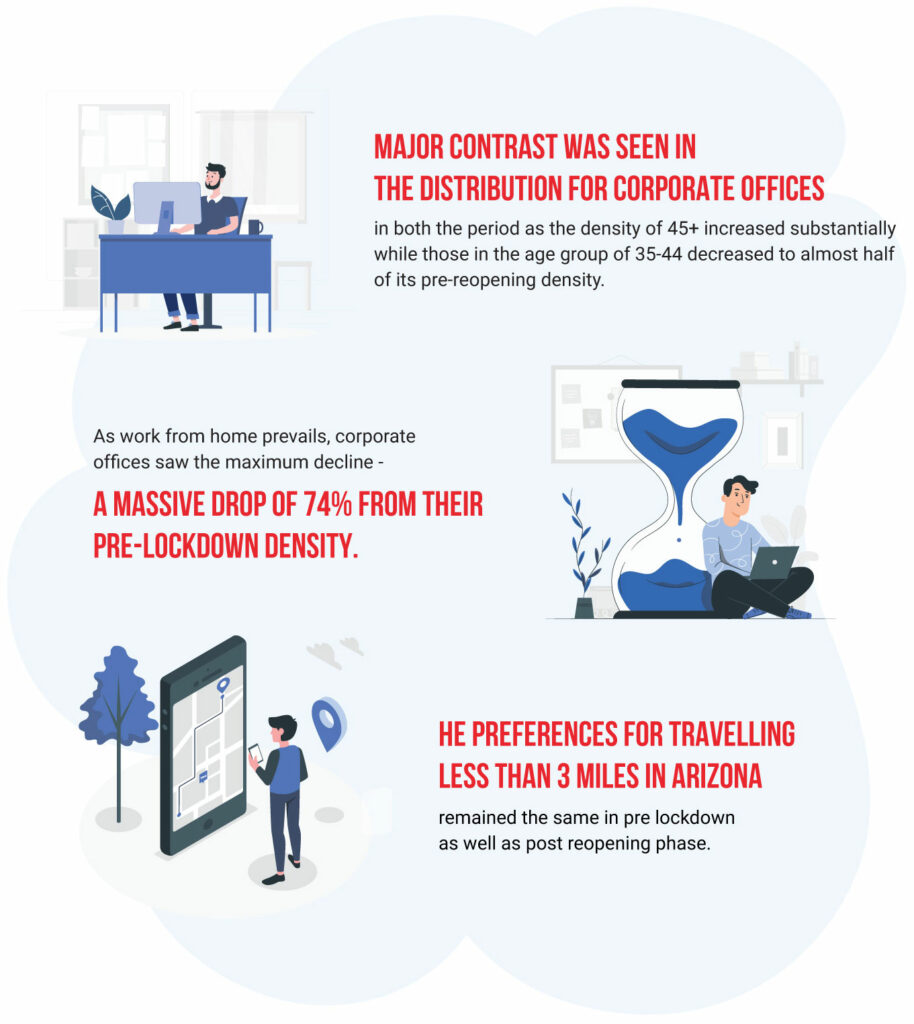
- As work from home prevails, corporate offices saw the maximum decline – a massive drop of 74% from their pre-lockdown density.
- After reopening, at an average, almost all the categories saw a sharp decline of roundabout to 50%.
To further our understanding of the residents’ behavior, we observed the density index across these categories during both pre and post-lockdown period.
Density Index – pre-lockdown
Density index – Reopening
The graph shows the county-wise change in average density across various categories during the pre and post-lockdown phase.
- Prior to lockdown, corporate offices, public transportation hubs and supermarkets had the highest density index.
- After reopening, as the cases started to rise, corporate offices saw a massive decline in density index which dropped from 4.3 to 1.1.
- In the post reopening period, the highest density Index was observed for supermarkets and public transportation hubs.
To further our analysis, we again looked at the county-wise change in average density on an aggregate level.
%age Change in Average Density by County
The graph depicts countywise percentage change in average density.
Interestingly, an aggregate level drop in average density was almost the same as it was at the individual category level.
Baby Boomers and Gen X dominate the post reopening traffic.
Breakup by Age Group Pre Lockdown
Breakup by Age Group after Reopening
The graph shows the age-wise change in average density across various categories during the pre and post-lockdown phase.
Similar to all the other states that we have observed so far while accounting the density to specific age groups, a stark contrast in pre and post-lockdown behavior was observed.
- In contrast to many of the other states, to begin with, 45+ comprised maximum density in the majority of the categories except for corporate offices. In the post reopening period, their density contribution increased even further.
- Major contrast was seen in the distribution for corporate offices in both the period as the density of 45+ increased substantially while those in the age group of 35-44 decreased to almost half of its pre-reopening density.
- Gen Zs’ were hardly visiting hair salons in the pre-reopening period, however, in post-reopening their footfall contributions to hair salons increased substantially.
Narrowing the travel to Neighbourhood.
Break Up by Distance Travelled Before Lockdown
Break Up by Distance Travelled Post Reopening
The graph shows the break up based on distance travelled for various categories during the pre and post-lockdown phase.
- The preferences for traveling less than 3 miles in Arizona remained the same in pre lockdown as well as in the post reopening phase.
- In the pre lockdown period, People in Arizona were more likely to travel more than 10 miles to visit corporate offices, however after reopening they were more likely to travel less than 3 miles to work.
- Corporate offices, places of worship and public transportation hubs were few of the destinations for which residents traveled miles.
Understanding whether this behavior is an immediate effect of the stay-at-home order or a long-term one is yet to be determined. Studying these visitation trends over longer periods can help brands stay relevant and plan for the future.
In case you missed our global analyses on the changing behavior of people in the real-world amid COVID-19, please download it here.
Disclaimer: The data is used to measure the impact on businesses and consumer behavior and is not an explanation for the infection rates. If you choose to reuse our analysis, please contextualize it and attribute the content to Azira. Azira’s data platform is privacy-by-design and the data is gathered from real-world signals in an anonymized and aggregated form.