FR
FR JA
JA

School closures have the biggest impact on amount of commuters on the road
Introduction
As news of confirmed COVID-19 cases spreads across the country, state and city officials enact policies, employees go remote (if possible), and events are postponed or cancelled. Major cities, including San Francisco, New Jersey, New York, and Los Angeles, have all enacted stay at home orders, but was that the tipping point for commuters? Did people start staying home once COVID-19 had a confirmed presence in their cities? Or did it take some other event (like school closures or the cancellation of major sporting seasons) to enact change?
Methodology
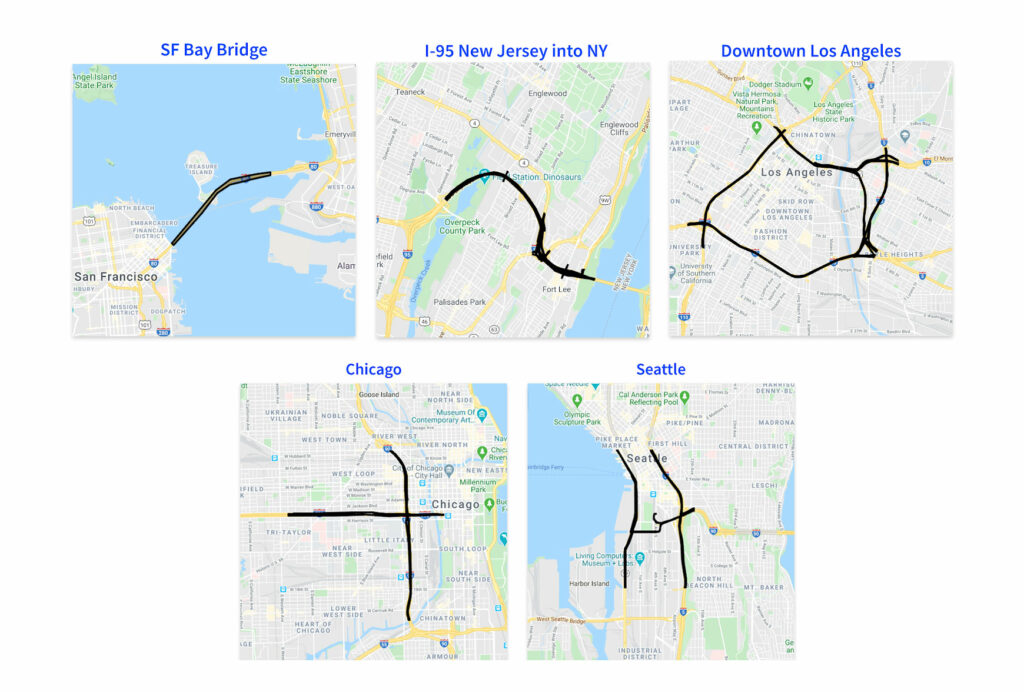
Freeway travel was identified by comparing samples of mobile location signals from devices observed in major traffic corridors in San Francisco, New Jersey/New York, Downtown Los Angeles, Chicago, and Seattle during the spread of COVID-19 in the United States and noting the changes in the amount of devices in each traffic corridor by day.
In order to determine whether or not a device was present in one of the traffic corridors on a given day, we first utilized precise study polygons to accurately identify if/when a visit occurred on a freeway of interest. Study polygons included the San Francisco Bay Bridge, the I-95 New Jersey into New York, the I-10 and I-110 in Downtown Los Angeles, the I-90 and I-290 in Chicago, and the I-5, I-90, and I-99 in Seattle.
Sample Devices
Our goal was not meant to capture every car, truck, or SUV that traveled through these traffic corridors during the duration of the study. This is because when analyzing devices in a study polygon, you can only ever see a sample of actual visitors to that study polygon. Not everyone opts into sharing their location data with apps, for example, and even in the case of a large dataset like Azira’s with 250 million active US devices, it will not contain data from every single device that travels in a given area. Instead, we harvested data from enough observed devices to achieve a 95% confidence interval in our sample and then compared that sample day over day to remain consistent over time.
Study Polygons
Analysis
San Francisco
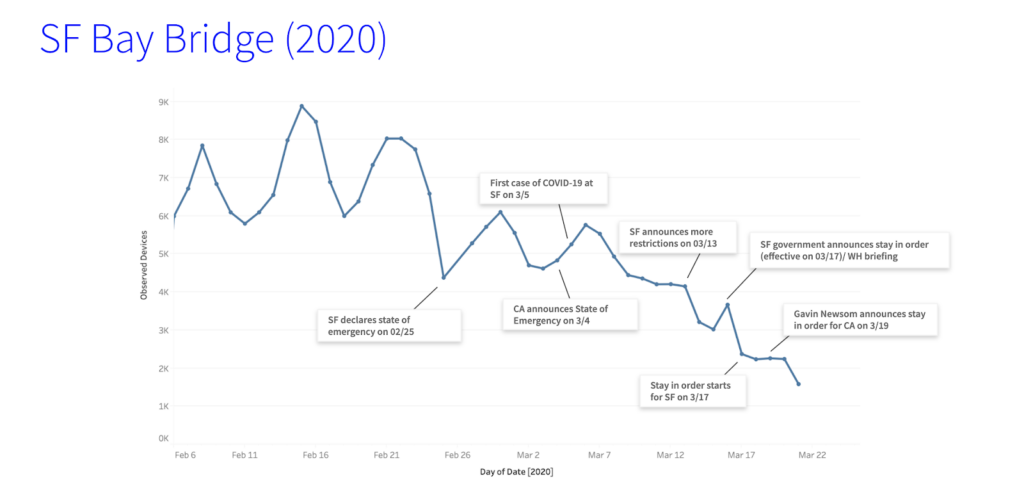
Traffic through the SF Bay Bridge traffic corridor drops significantly when San Francisco declares a state of emergency on February 25 and has continued to trend downward as more policies have been enacted by both the city of San Francisco and the state of California.
On February 25, when San Francisco announced a state of emergency, traffic dropped 27.01% when compared to one week prior.
On March 19, when California announced a stay at home order and school closures, traffic dropped 46.27% when compared to the previous week.
Between February 6 and March 22, San Francisco experienced a -73.57% drop in traffic on the San Francisco Bay Bridge.
Downtown Los Angeles
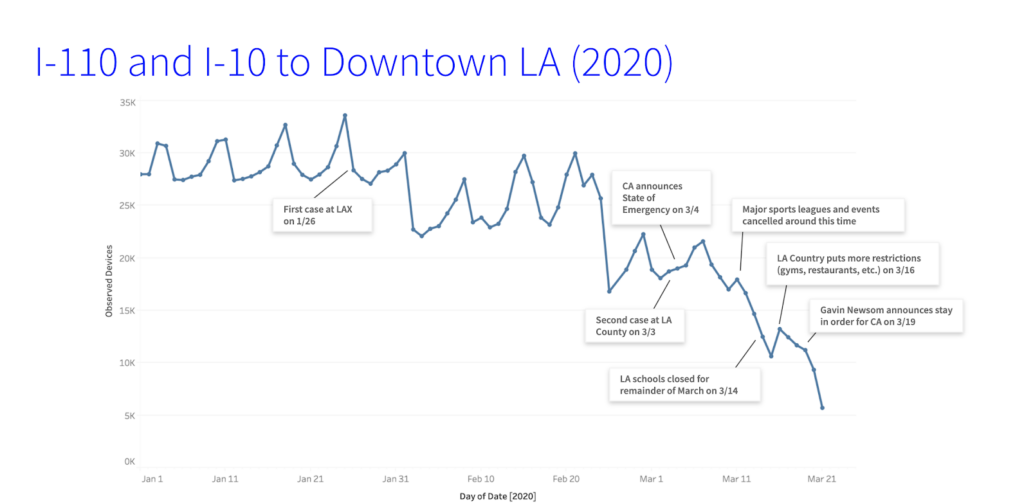
Traffic around Downtown Los Angeles ebbs and flows for a few weeks following the first confirmed case of COVID-19 at LAX. Starting at the end of February, traffic began to trend downward, with the cancellation of major sports league events correlated to one of the largest drops.
There was little impact on traffic when Los Angeles announced a state of emergency on March 4, with a 2.14% increase in traffic vs. one week prior.
The trend downward in traffic began after Stagecoach and Coachella were postponed (-9.12%), and NBA and other sports leagues were postponed or cancelled on March 11 (-5.57%) and March 12 (-13.69%).
When LA Schools close on March 14, we saw a 42.14% reduction in traffic when compared to the previous week.
When Governor Gavin Newsom announced the stay in order on March 19, there was a 32.61% reduction in traffic compared to the previous week.
Between January 1 and March 22, Downtown Los Angeles experienced a -79.57% drop in traffic on the I-110 and I-10 freeways.
New Jersey (Commuting into New York)
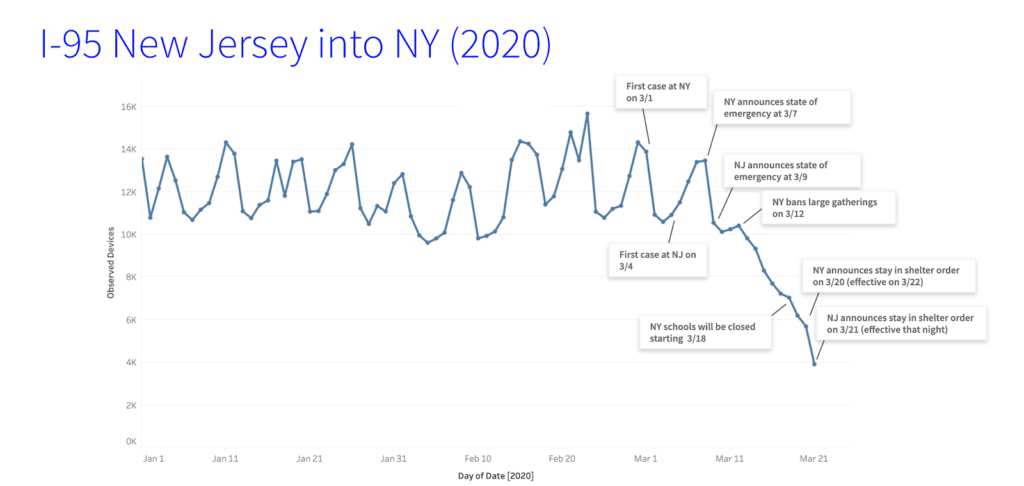
The commute from New Jersey into New York remains consistent until the first week of March, when both New Jersey and New York confirm their first cases and both states announce a state of emergency. Once New York bans large gatherings on March 12, traffic steadily declines.
Both New York and New Jersey announced states of emergency within days of each other. On March 7, when New York announced its state of emergency, traffic decreased 2.99% compared to the week prior. Traffic decreased 4.38% when New Jersey announced its state of emergency.
After New York City closed schools on March 12, traffic decreased 21.29% compared to the previous week.
When New York and New Jersey announced their stay in orders on March 20 and March 21, respectively, traffic dropped 58.06% compared to the previous week.
Between January 1 and March 22, New York and New Jersey experienced a -71.11% decrease in traffic on the I-95.
Downtown Chicago
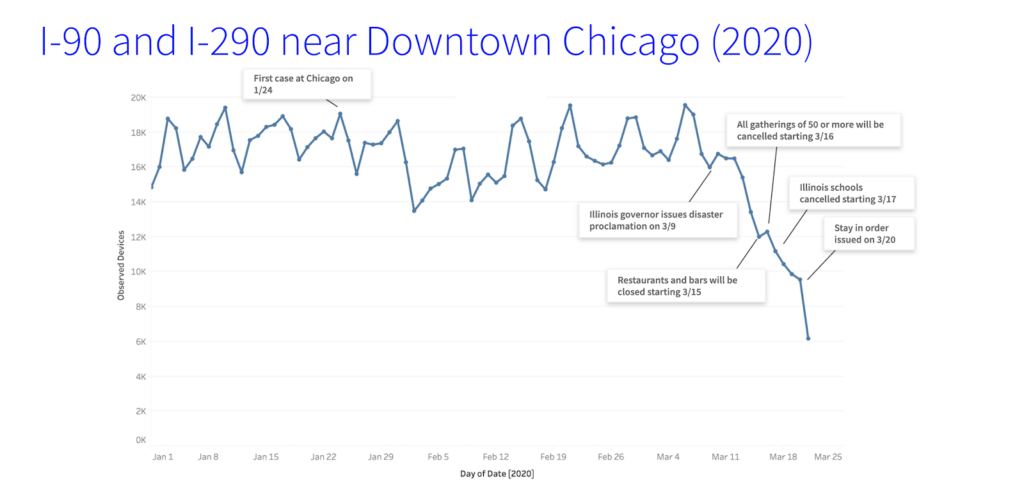
Traffic in Chicago continues for well over a month after the first case of COVID-19 is confirmed, and only sees a trend downward after the Illinois governor issues a disaster proclamation on March 9.
Traffic dropped 36.76% the day after Illinois schools were cancelled on March 17.
When Illinois issued the stay in order on March 20, traffic decreased 38% compared to the previous week. March 21, the day after the stay in order was issued, traffic decreased 54.04%.
Between January 1 and March 22, Downtown Chicago experienced a -58.43% decrease in traffic on the I-90 and I-290.
Downtown Seattle
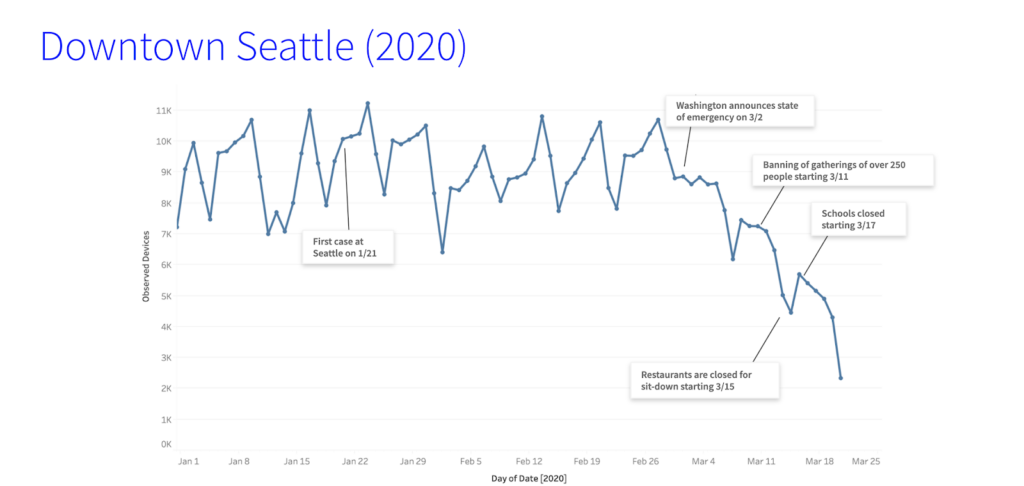
Freeway traffic around Downtown Seattle decreased after Washington announces a state of emergency on March 2.
When restaurants closed for sit-down dining on March 15, traffic decreased 27.93% when compared to the previous week.
When Seattle closes schools starting March 17, traffic in Seattle dropped 25.48% when compared to the week prior.
Between January 1 and March 22, Downtown Seattle experienced a -67.63% decrease in traffic on the I-5, I-90, and I-99.
Conclusion
It appears that school closures associated with COVID-19 have had the biggest single impact on a city’s commuting patterns when compared week over week. The only outlier was the commute between New York and New Jersey, which was most impacted by the stay in orders issued by the state.
All cities experienced a dramatic drop in traffic during the study period, with Los Angeles being the greatest decrease in observed devices on freeways (-79.57%) and Chicago being the least (-58.43%).
Azira copyright notice and disclaimer: No reproduction or use is permitted without Azira’s express written consent.