FR
FR JA
JA

Explore any timeframe, with more than 3 years of history:
Most businesses have experienced significant change over the last 3 years. That’s why the on-platform experience has preloaded data starting from 2019 to today. Analyze how changing consumer behavior affected footfall to your locations and your competitors.
Find locations you’re interested in:
The search functionality in the Azira Pinnacle platform lets you easily find more than 1.2 million stores and other locations with preloaded data for hundreds of brands across retail, restaurants, auto, banks, and more. Search by brand name, industry, or address to find relevant locations.
Whether you want to look at a single location, compare with competitors, or look at several different locations in a market, Pinnacle lets you quickly adjust with just a few clicks.
Azira’s advanced ML model gives you a relevant baseline visitation pattern based on the industry, brand, geography and time period you’re looking at. For example, if you’re looking at 3 different QSR brands in Seattle, you can see an average baseline for all QSRs in Seattle. However, if you look at 5 Starbucks locations across the U.S., you would see an average baseline of Starbucks for all of the U.S. This baseline lets you immediately know how the specific location(s) you’re looking at compare to a broader average.
How Azira Pinnacle helps you share insights:
Discovering insights is important, but the key to making better business decisions is sharing them with stakeholders. Pinnacle Data makes it possible to easily find and export datasets off-platform to use in any tools. And now Azira Pinnacle also added new features that allow you to easily download and share the visuals and data that convey the insights you find on-platform.
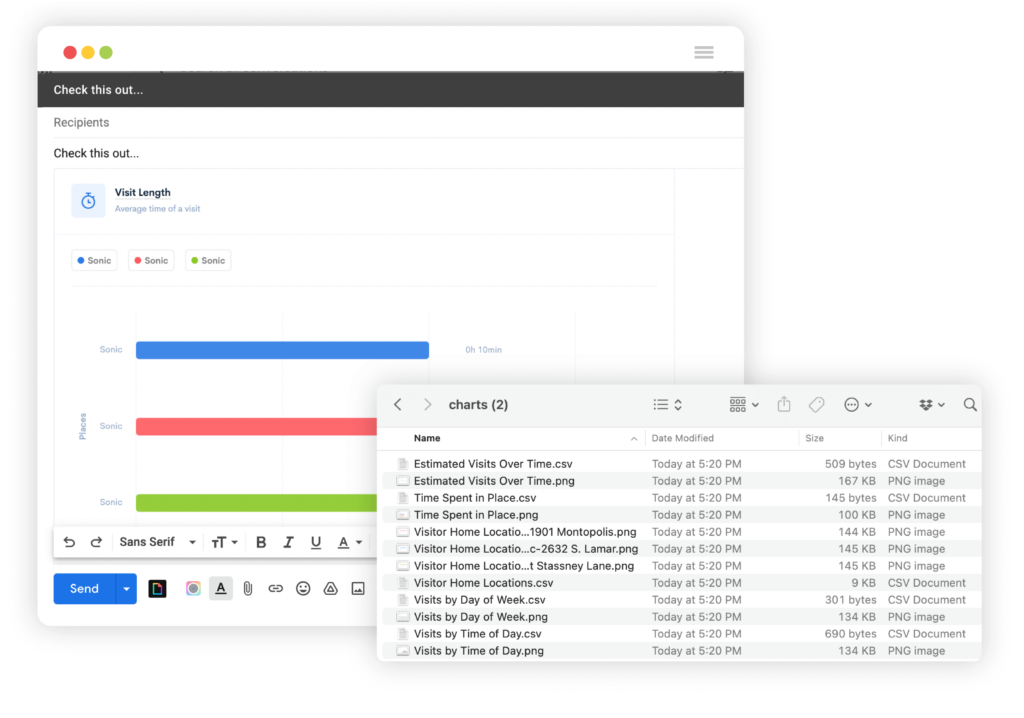
With our new feature to download charts or maps, you can take your learnings from the platform in a few short clicks and get .csv data files and .png images files to share.
Here’s how it works:
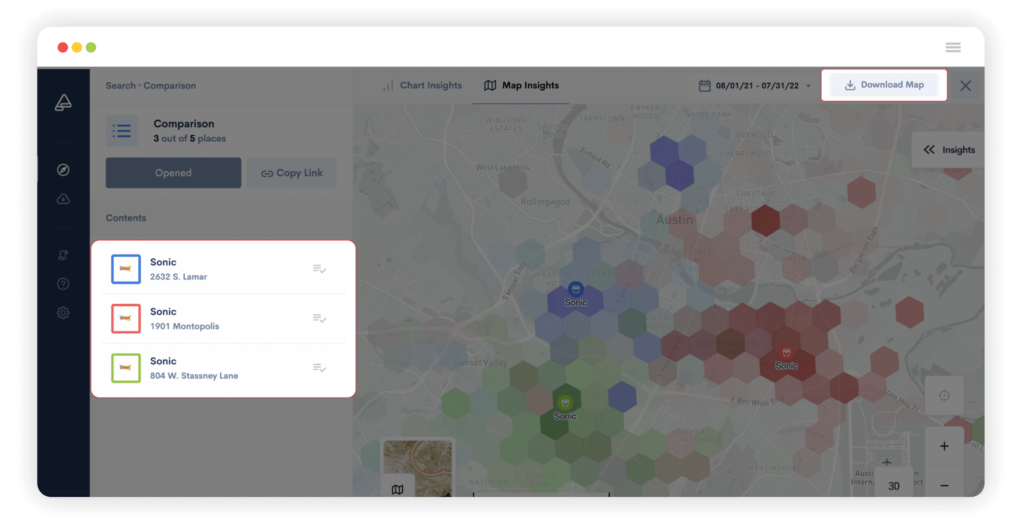
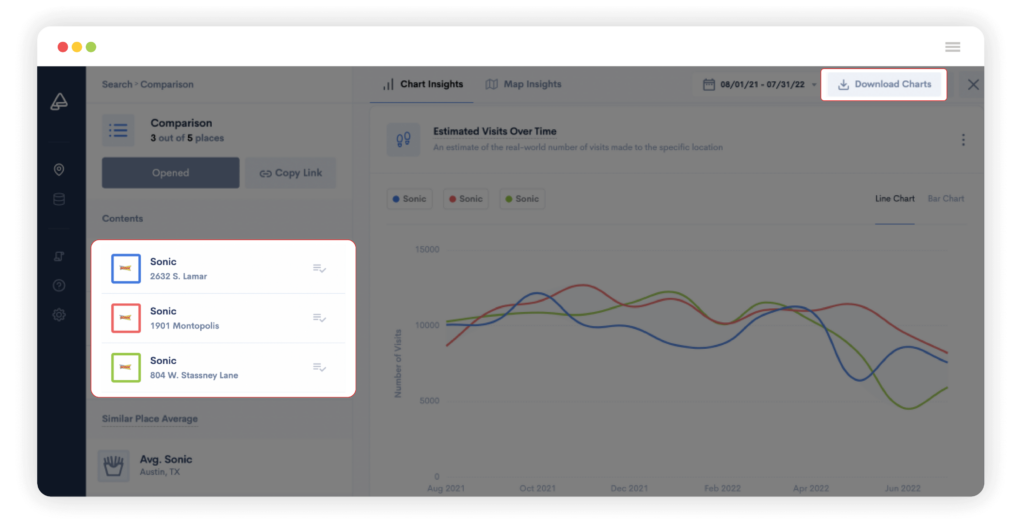
- Discover insights in the platform. Below is a comparison of 3 Sonic locations in Austin, TX. Once you’ve honed in on the insights you want to share, you can click Download Map or Download Charts in the upper right corner. You can also download a single chart.
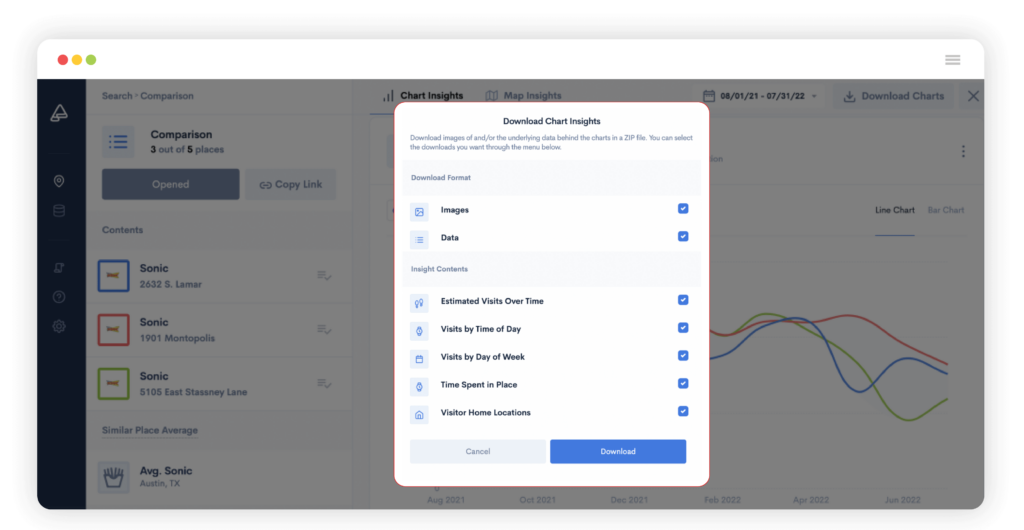
- Select which outputs you want to download.
- Use the image and .csv files to share insights in whatever way will resonate with your team, whether that’s via slides, emails, chat, etc.
With this new functionality, it will be easier than ever not only to discover the answers to key questions around consumer behavior, but also to share the insights that will power business decisions.
Contact us today to learn more.