.svg)
Introducing Estimated Visits - Grocery: “The Why” and “The What”


We are thrilled to announce the general release of the Estimated Visits - Grocery dataset in Pinnacle. This offering provides capabilities, like visit forecasts and insights on competitive dynamics, not previously available in the Azira platform. The underlying methodology makes possible a range of innovative features, which will be available in future updates as we determine the best way to maximize their business impact for customers.
The new product comes with many great features, but it is very different from our other data offerings. This move is driven by changes in the location data ecosystem that have occurred over the last few years (“The Why”), and this particular solution to address those issues (“The What”). It turns out that this is the first of what we expect will be several new product updates that address the “new normal” for location data, in an effort to provide the types of insights our data has provided in the past, but also to provide important new insights for our customers.
The Why
Regulatory changes and new legislation surrounding mobility and location data, along with well-publicized abuses, have made first-party data providers, such as application publishers, less likely to share their data or have increased restrictions on what resellers can provide customers. Many no longer allow the sale of latitude and longitude coordinates (even when "jittered") or mobile device IDs, once industry norms. This has caused the supply of real mobility data to contract, replaced by fraudulent data from bad actors.
The Estimated Visits - Grocery dataset is built on a worst-case scenario for the future mobility data ecosystem. The key assumptions of this scenario are:
- Very limited quantities of new high quality mobility data will be available
- Historic high quality data will need to be leveraged
- Other types of data, such as POI attributes, demographic, and transportation network data, and seasonal/holiday effects will need to be used
Since we started working on this, we have learned that the new normal for consumer location data is not as sparse as we initially feared. However, to provide a number of the insights provided by our historic data offering, the methodology developed for Estimated Visits - Grocery will be an important component.
The What
The data environment being addressed is very commonly seen in economics, less so in computer science, so the underlying framework is based on a “bottom-up” economic model of shopper behavior. Visit estimates are based on a two-model approach that is applied to over 1,500 geographic areas in the US, in order to capture local differences in shopper behavior. The first model provides estimates of the number of shopping trips to any store in the category (grocery stores currently) by households in a small census defined residential area. The second model estimates the share of visits that each store close to that area will receive based on characteristics of each store, demographic characteristics of households in the residential area, and the proximity of each store to that residential area.
A detailed discussion of the models used can be found here. In addition, documentation on how to create an estimated visits report in Pinnacle can be found here, and information on how to interpret the report can be found here.
One important point is that the initial release of this dataset focuses on the behavior of local customers, and does not include customers who reside outside of the area.
Accounting for visits by “visitors” will come next. Given the nature of the models used, the purpose of the estimates are to capture trends in visits, and not exact estimates of the number of visitors on a given day to a particular store. Since the estimates are the expected mean number of visits on that day, the data is smoother than what is seen based on Zero Point report data. In a future update we will include error bands around the estimates.
To illustrate the capabilities of the dataset, here’s an example of three stores located in the San Antonio, TX metropolitan area. The three stores are the H-E-B supermarkets in Floresville and La Vernia, TX, while the third store is a Walmart Supercenter (a hypermarket) located in Floresville. The figure below shows a time series of estimated visits to each store that runs from October 1, 2024 to February 15, 2025. Seasonal aspects of grocery shopper behavior are clearly visible in the figure. There is a very strong day of week pattern in grocery shopping, with Fridays and weekends being peak grocery shopping days, with much lower levels of shopping mid-week. Holidays also have an important effect on grocery shopping, with major spikes and troughs associated with Thanksgiving, Christmas, and Easter.
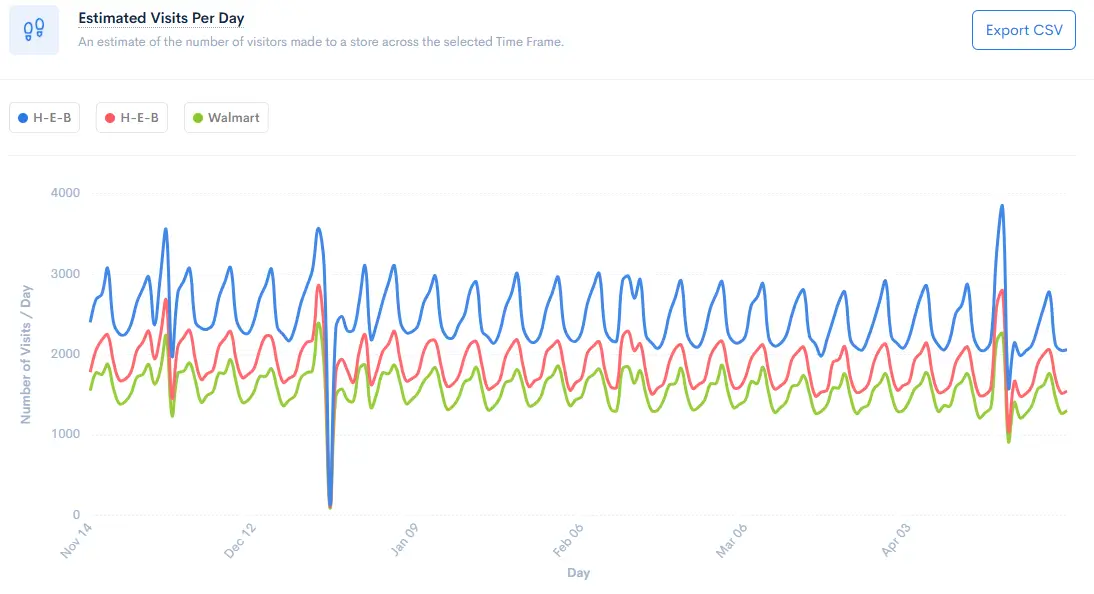
Apparent from the figure is that the La Vernia H-E-B store (in blue) has a base level of sales that is greater than either of the two stores in Floresville. The reason for this difference is due to the level of local competition shown in the figure below.
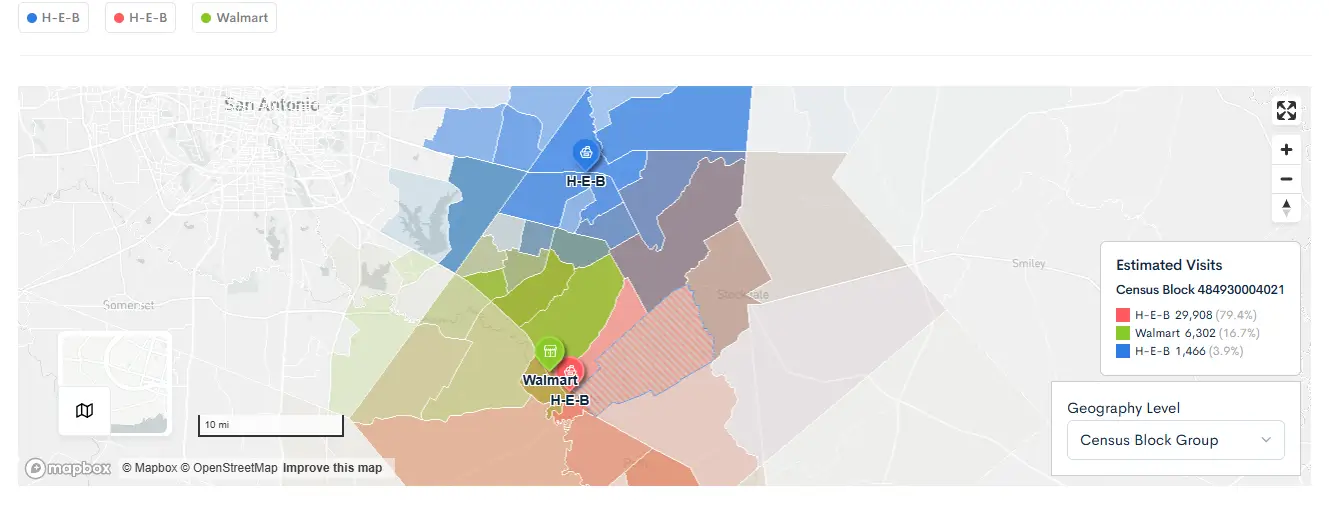
The map above shows the relative visit share of the three stores for different Census Block Groups. The La Vernia H-E-B store, represented in blue, has a larger number of comparatively uncontested Block Groups to its north. The Walmart Supercenter has the smallest number of comparatively uncontested block groups before it enters into strong competition with the Floresville H-E-B (red) to its south, and the La Vernia H-E-B store to its north. Because of the proximity to one another, the competition between the two Floresville stores is particularly strong, but all three stores compete with each other in some areas of the map. On balance, the competitive environment favors the La Vernia H-E-B stores, which accounts for its higher expected base level of store visits.
We are excited to make Estimated Visits - Grocery available to our customers and we are extremely happy with our progress — but we know it will change to better meet your needs through your feedback. More importantly, this represents our first new dataset on the journey to the “new normal” for consumer location data

.svg)