.svg)
Year of the Snake: Decoding Consumer Behavior During Lunar New Year


Lunar New Year is one of the most widely celebrated holidays, drawing hundreds of millions to cultural events and tourist attractions each year. This year marks the Year of the Snake, symbolizing rebirth, regeneration, love, and happiness.
We examined Lunar New Year celebrations on January 29th across Singapore, Hong Kong, Malaysia, and Sydney, Australia—home to one of the biggest Lunar New Year festivals outside of South East Asia. From identifying who attended Lunar New Year festivities, the most frequented paths to event spaces, and how people got to the events, our findings reveal key insights that marketers can use to connect with these audiences at the right place, at the right time, and with the right message.
How far did attendees travel for Lunar New Year celebrations?
Azira’s data revealed that Lunar New Year celebrations were frequented by all age groups. Most attendees across South East Asia and Australia were locals, with some international presence varying by location.
Across three major Lunar New Year events in Hong Kong — Cathay International Chinese New Year Night Parade, Hong Kong Cultural Centre Piazza Lighting Ceremony, and Lam Tsuen Wishing Tree Festival — locals made up 85% of attendees. The largest international segments included Korea (5%) and Taiwan (5%), with additional visitors from the Philippines, Vietnam, and China.
Among international visitors to Hong Kong, approximately 21% were aged 15-29, 27% were 30-44, 26% were 45-59, and 24% were 60+.
In addition, we looked at visitation at Lunar New Year festivities across Singapore, Malaysia and Sydney, Australia, revealing similar trends:
What were the most frequented paths taken by attendees?
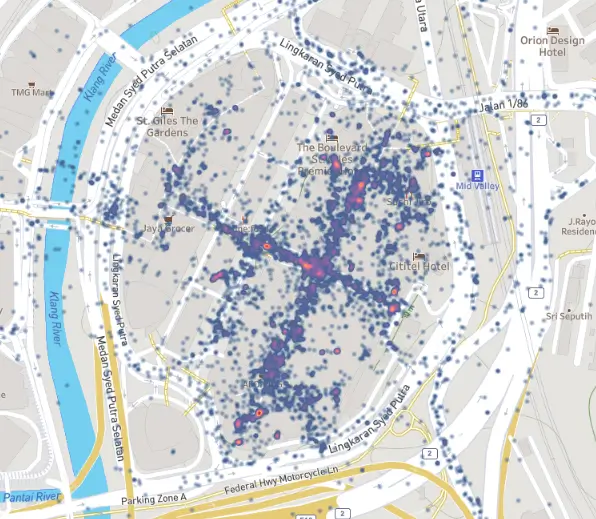
With Azira’s heat mapping capabilities, marketers can identify which paths to an event space are the most or least frequented. From the map below of the Mid Valley Megamall in Malaysia during Lunar New Year festivities, we see that the Mid Valley train station (east of the mall) was a key access point. Many attendees also arrived from the Mid Valley South Court bus station near Parking Zone A on the south-west side of the mall.
How much did the festivities influence foot traffic?
Azira’s data revealed significant spikes in foot traffic during Lunar New Year festivities across both South East Asia and Australia compared to a corresponding day one month earlier:
- The Art Gallery of New South Wales, Australia saw a 44% rise in visitors, driven by dance performances, the largest display in in Australia of Chinese artist Cao Fei’s work, and extended museum hours.
- The Cathay Parade in Hong Kong boosted foot traffic to the Tsim Sha Tsui district by 21%.
- Singapore’s Chinatown District saw a 12% increase in visitors, as festive lights and lantern displays drew crowds.
Additionally, the Lam Tsuen Wishing Tree in Hong Kong experienced 25 times more visitors during Lunar New Year compared to its monthly average. Crowds gathered for a special tradition where people toss a placard with their wishes, along with a mandarin, onto the tree in hopes of having their wishes granted.
How long did attendees spend at Lunar New Year events?
According to Azira’s insights, Mid Valley Megamall in Malaysia (66 minutes) and the Art Gallery of New South Wales in Australia (79 minutes) had the longest dwell times. The mall's extensive shopping options alongside the festivities encouraged visitors to stay longer, while the museum's special exhibits also extended visits.
In contrast, the Lam Tsuen Wishing Tree in Hong Kong had a shorter average dwell time (31 minutes), as visitors stopped by briefly for the wishing tradition before moving on.
With consumer behavior insights, marketers can refine audience targeting, enhance location-based ad strategies, activate campaigns across multiple channels, and measure their effectiveness. Large-scale celebrations like Lunar New Year provide valuable data that help destinations, restaurants, and retailers gain a deeper understanding of their customers—where they go, what they do, and how long they stay. These insights enable businesses to make data-driven decisions that drive foot traffic, optimize marketing spend, and ultimately maximize their return on investment.
Learn more about how Azira’s consumer behavior insights contact us today.
Related posts

The Future of Boston Tourism Isn’t More Visitors — It’s Returning Ones
.svg)

Beyond the Terminal: How Azira’s Airport Insights Turn Traveler Behavior Into Smarter Digital Advertising
